Learning Objectives
Main
◇ Know how to improve your own reproducibility?
◇ Be able to use markdown editors.
Minor
◇ Be able to judge if a study is reproducible.
◇ Learn to use RegEx.
Challenges
Sample naming
❖ Challenge #1 Naming your samples logically and consistently is crucial. What would you recommend to improve to names of these samples.
Waßer1              Negative control Extraction
null5               Negative control PCR
sample 1111111-5    Sample 5 from population Gais
sample 1111111-5    Sample 5 from Population Gais (Replicate)
u                   Sample 17 from Population Wallis
LS-20-c0 ct         Sample c9 from Control Zürich ct
d_3                 Sample 3 from Species d in 2016
U0222233939         Possibly contaminated
Gais 2              Sample 2 from Population Gais
Gais_222            Sample 222 from Population Gais
Markdown
Most of the primary data analysis is done in the linux environment and you will use different commands e.g. saved in your bash history. To increase reproducibility of your logs or scripts, we are going to use a markdown editor.
❖ Challenge #2 Open your markdown editor. Explore the markdown editor yourself. Try to generate titles of different sizes, add plain text, code a pictures. Use either the features in the insert menu or the cheat sheet. Try to recycle code snippets from the terminal challenge and add comments. Then you can export your file and save it as an html or pdf. What is the advantage of the pdf version? If you like to present your results in a table you can use webtools like TableCovert to reformat text files to markdown.
RegEx
Quote
A regular expression is a sequence of characters that define a search pattern. Usually such patterns are used by string searching algorithms for "find" or "find and replace" operations on strings, or for input validation. The most famous RegEx is the wildcard character *, which matches everything.
RegEx can be used in different languages (R, bash, python, ..) often they are slightly different. We going to explore them in an editor. Advanced users can use bash or any other language as well.
❖ Challenge #3 Download the table from the course website here and open it with your editor. Go to the find and replace section and activate the regex mode. Remove the ending (_L*) from each fasta header. The cheat sheet might be helpful.
Brackets suggestion #3
>([A-Z,0-9]+)_L[0-9]+

>$1
Bash suggestion #3
sed -r 's|>([A-Z,0-9]*)_L[0-9]*|>\1|g' Rep_regex.fas
Often you need to make sure that you consider all possible patterns and finding the correct RegEx can be challenging but there are testers available, which are often very helpful.
RMarkdown
To conduct the analysis and generating a report at the same time we are going to use RMarkdown. As soon as you could reduce the data during the primary analysis, RMarkdown offers you a powerful tool to do reproducible research.
❖ Challenge #4 Set up a markdown document using Rstudio. Explore the markdown editor yourself using the example.
❖ Challenge #5 Use your own code from the "dice-task" and pimp your code. We would like to see some before-and-after pictures.
Additional Information
R Code with Style
Style Guides
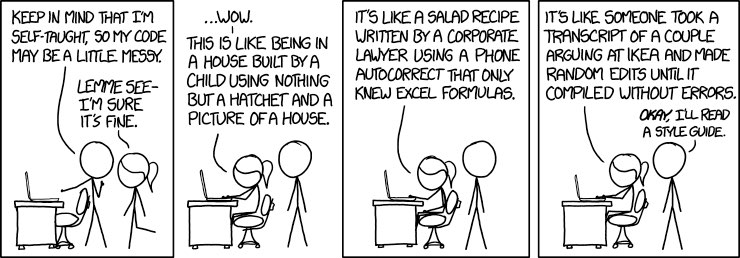
Picture Source: https://xkcd.com
Style Packages
-
styler -
install.packages("styler") -
lintr -
devtools::install_github("jimhester/lintr") -
formatR / Help with formatR -
install.packages("formatR")
Code Folding
RStudio supports both automatic and user-defined folding for regions of code. Code folding allows you to easily show and hide blocks of code to make it easier to navigate your source file and focus on the coding task at hand.
To insert a new code section you can use the Code > Insert Section command. Alternatively, any comment line which includes at least four trailing dashes (-), equal signs (=), or pound signs (#) automatically creates a code section.
## Setup ----

## clean/reset environment
rm(list=ls())

## R and Bioconductor libraries
library(ggplot2)

## Data Import ----

otufile <- "ZOTU_c99_Count_Sintax.txt"
mapfile <- "MapFile.txt"

## Import into Phyloseq
d.ZOTU <- import_qiime(otufilename = otufile, mapfilename = mapfile)
d.ZOTU
Tabs in rmarkdown
## data {.tabset}

### summary

```{r}
summary(iris)
```

### scatter plot
```{r}
plot(iris$Sepal.Length,iris$Species)
```

### boxplot plot
```{r}
boxplot(iris$Sepal.Length~iris$Species)
```
Show another scripts in rmarkdown
Scripts needs to be in the same workign directory.
```{r, file='Import.R'}

```
Or a bash-script
```{bash, file='make_faste.sh'}

```