Learning Objectives
◇ Understand the basic concepts of reproducibility, including transparency in data collection, analysis and reporting to ensure that research results can be independently verified.
◇ Become familiar with literate programming (e.g. RMarkdown) and data management practices to create research workflows that can be easily reproduced by others.
◇ Learn to integrate reproducibility practices into your own work to ensure that your analyses, code and data are well documented, shareable and ready for future reuse or validation by other researchers.
Reproducible research is the practice of ensuring that others can repeat your analysis and get the same results, using the same data and methods. It is essential because it maintains the credibility of scientific findings by allowing for independent verification and validation. Reproducibility promotes transparency, builds trust in research, and supports future discoveries by allowing other scientists to build on previous work.
However, achieving reproducibility can be challenging. Common challenges include poor documentation of data and methods, reliance on proprietary software, and changing standards for data storage and sharing. In addition, differences in computational environments can make it difficult to accurately replicate results. Addressing these technical barriers, while maintaining clear and open research practices, is critical to advancing reproducibility in science.
As data analyses become more complex, the need for reproducibility increases. The focus shifts from simply reporting results to providing a clear, detailed description of the analytical process so that others can validate and build upon it.
-
Describing Processes: Clearly explaining even simple processes can be difficult, and misunderstandings can lead to mistakes and wasted effort. Providing thorough, accurate descriptions is key to reproducibility.
-
Click Manipulation: Manual data manipulation through interfaces can be convenient but is hard to replicate and prone to errors. Once completed, it becomes difficult to trace the steps and identify mistakes.
-
Script-Based Solutions: Using scripts to automate processes, paired with detailed documentation, enhances reproducibility. Scripts provide a clear, repeatable method for conducting analyses, reducing errors and simplifying future replication.
-
Value of Reproducibility: While creating reproducible workflows can take time, it pays off by saving effort in the long run. A reproducible solution can be reused for similar problems, and sharing these solutions benefits the wider scientific community.
By focusing on reproducibility, you can improve the reliability and efficiency of your research, making it easier for others to follow, verify, and build upon your work.
Example 1: Reformatting A Sample List
This example will show you how to reformat a sample list safely and reproducibly using terminal commands instead of a spreadsheet program.
Open your terminal and make sure you’re in the correct directory:
- Use
pwdto check your current directory. - If necessary, create a new directory and navigate to it:
mkdir -p ${HOME}/RepRes
cd ${HOME}/RepRes
Download the sample table using curl, ensuring the file retains its original name from the remote server:
curl -O https://www.gdc-docs.ethz.ch/UniBS/EvolutionaryGenetics/BioInf/data/Table.txt
View the contents of the downloaded file:
cat Table.txt
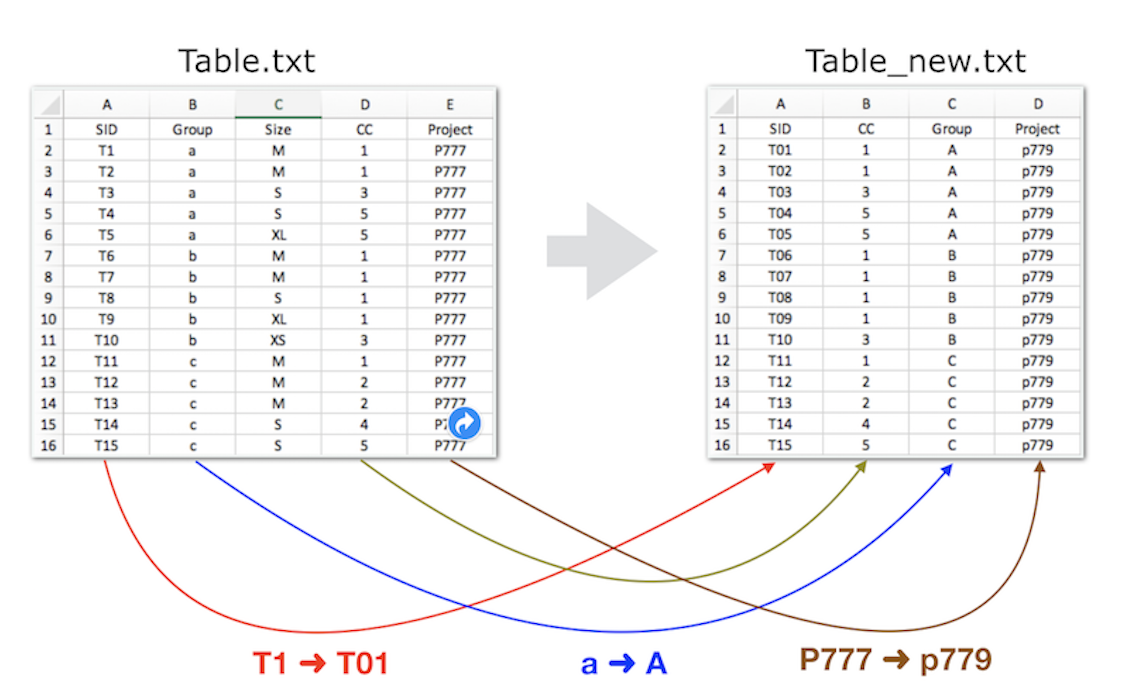
Task: Your goal is to reformat the sample list by performing the following steps:
Exclude the "size" column.
Reorder the columns.
Modify the sample ID (SID) for the first 9 samples (e.g., change T1 to T01).
Convert the group name to UPPERCASE.
Renaming the project (e.g., P777 to p779).
While this task is manageable with a spreadsheet editor, working with larger datasets can make it more error prone, harder to describe clearly and less reproducible. Relying on manual, click-based tools such as spreadsheet editors often makes it difficult to document changes and ensure consistency.
Terminal-Based Solution Using awk
Here’s a simple way to achieve the reformatting using the awk scripting language. Ensure Table.txt is in the current directory before running the script.
awk '{
  if (NR == 1) print $1, $4, $2, $5;                           # Print header
  else if (length($1) > 2) print $1, $4, toupper($2), "p779";  # Change project number
  else print "T0" substr($1, 2, 3), $4, toupper($2), "p779";   # Rename samples < 10
}' Table.txt > Table_new.txt
cat Table_new.txt
Important: The original file remains unchanged to ensure you can repeat the reformatting process if needed. Avoid modifying original files directly.
Alternative - Using a Bash Script
Download the bash script for reformatting:
curl --verbose -O https://www.gdc-docs.ethz.ch/UniBS/EvolutionaryGenetics/BioInf/script/reformat_table.sh
Review the bash script:
cat reformat_table.sh
Make the script executable:
chmod a+x reformat_table.sh
Run the script (ensure Table.txt is in the same directory):
./reformat_table.sh Table.txt
Compare the original and reformatted tables:
cat Table*.txt
This example illustrates different methods to reformat data, demonstrating both direct command-line processing and scripted solutions.
Provide Code for Simplicity
Reproducibility in research can often be achieved more efficiently than it seems. Rather than describing each step in exhaustive detail, consider providing a well-documented script. A script not only encapsulates the entire process, but also ensures that others can easily replicate your work with minimal effort.
Keep The Original Safe
Always keep the original file intact and work from a copy when making manipulations. Working from a copy helps prevent accidental data loss or irreversible changes. By keeping the original file, you maintain a fallback option and ensure that you can revert to the unmodified data if necessary.
Example 2: Producing Figures and Performing Statistical Tests
This example shows how terminal commands combined with R can be used to generate reproducible figures and perform statistical tests, providing a more efficient alternative to using a spreadsheet editor.
First, download the archive file containing the necessary data and scripts using curl, then unzip it:
curl -O https://www.gdc-docs.ethz.ch/UniBS/EvolutionaryGenetics/BioInf/script/BoxPlotExample.zip
unzip  BoxPlotExample.zip
rm -fr BoxPlotExample.zip  # Clean up the zip file
After unzipping, confirm that you have 8 files in your working directory.
## Data Files (n=2)
ls -l data?.txt
# data1.txt: smaller data set
cat data1.txt
# data2.txt: bigger data set
head data2.txt
## Spreadsheet Files (n=2)
ls -l figure*.*x*
# figure1.xls:
# figure1.xlsx:
## R Files (n=4)
ls -l Boxplot*
# Boxplot.R         - The main R script for generating box plots.
# Boxplot.Rfunction - Contains reusable R functions.
# Boxplot.Rscript   - Execution scripts that automate the process.
# Boxplot_2.Rscript - Execution scripts that automate the process.
Using a spreadsheet editor
Let's start with a popular but less reproducible approach. Open one of the spreadsheet files (xls or xlsx) using a program such as Apache OpenOffice, LibreOffice or Microsoft Excel and examine the contents. In the xls file, the graph is missing, but the data in columns A and B match the data in data1.txt.
A t-test has been performed to compare the two sets of data (columns A and B) and the p-value is displayed above the box plot.
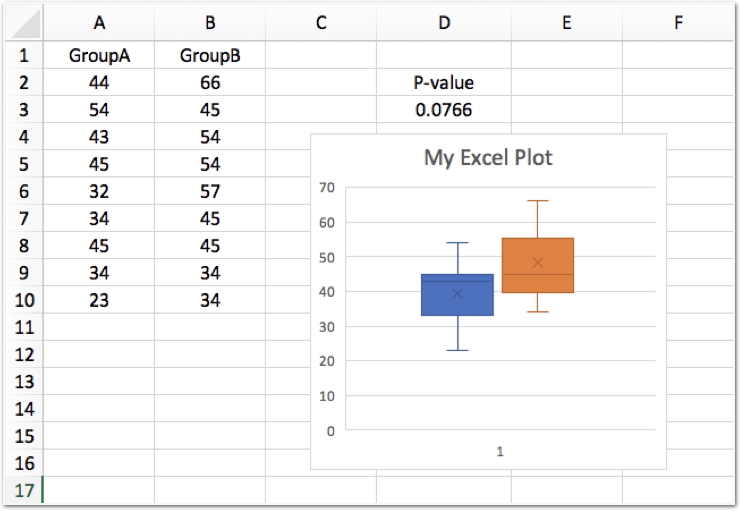
Task: Using this spreadsheet as a template, repeat the plot and t-test for data2.txt instead of data1.txt. After exploring how to do this manually using a spreadsheet editor, we'll move on to more reproducible solutions using R and terminal-based tools.
Terminal and R Solution
While the terminal isn't usually ideal for creating plots or running statistical tests, it can be done without leaving the command line. We'll use an R script to generate boxplots and run a t-test.
First, open the supplied R script (Boxplot.R) in RStudio and make sure your working directory is set up correctly. The process should be straightforward from here.
To run the script directly from the terminal, use the following command:
Rscript Boxplot.Rscript data1.txt
After running the script, review the output file (Boxplot.jpg) to see the generated plot. You can also review the R script to understand how the box plot and t-test were generated.
This approach, unlike the spreadsheet editor, ensures reproducibility and clarity in documenting the steps.
A slightly different way
Let us repeat the analysis with the second R script.
Rscript Boxplot_2.Rscript data1.txt
Review the R script. You'll notice it’s much shorter than the previous one. On line 6, the script calls a separate R function file (Boxplot.Rfunction). To fully understand what the script does, you’ll need to examine the function itself:
cat Boxplot.Rfunction
You may notice that this function shares similarities with portions of the previous R script. It introduces control structures (such as if-else statements), and the output format is different, generating a PDF file (Boxplot_with_Function.pdf).
Both R scripts achieved the same result, but took slightly different approaches. The second script introduced a more modular design by calling functions, which not only made the script shorter, but also more reliable and reusable. Using functions within scripts is an effective way to streamline your workflow, save time and improve reliability, especially if those functions are well tested and can be reused for different tasks.
Key Takeaways
These two examples show that working with scripts is not only easier, but also safer. Once a script is written, it can be reused or easily modified for different data sets. This ensures that your data analysis remains transparent, reproducible and less prone to error than manual methods such as using a spreadsheet editor.
The Importance of Integrity in Science: Upholding Trust, Transparency, and Ethical Conduct
Trust, integrity, and transparency are fundamental pillars of scientific inquiry. These values allow researchers to collaborate, build on each other's work, and advance knowledge for the benefit of society. However, fraud and misconduct do occur in science, just as they do in other areas of life. A small minority of individuals may deliberately manipulate data or results to promote their personal beliefs, gain recognition, or advance their careers. While these cases are the exception, they pose serious risks to the credibility of science and undermine public trust.
True scientists uphold the principles of honesty and openness, and recognize that the pursuit of knowledge requires rigorous ethical standards. Even small compromises, such as selective reporting of data or cutting corners in analysis, can lead to larger problems over time. What begins as a seemingly minor deviation from ethical practice can snowball, leading to flawed conclusions, retracted papers, and damage to the researcher's reputation. This erosion of scientific integrity not only misleads fellow researchers, but can also harm the public good when research informs policy, medical treatments, or technological innovations.
Moreover, the consequences of scientific misconduct are far-reaching. In addition to damaging individual careers, fraudulent practices can stall entire fields of research, waste resources, and misguide future studies. It can also slow progress by obscuring true findings, as efforts to replicate or build on false results can lead others down unproductive paths.
In contrast, the practice of ethical science - characterized by careful documentation, transparency, and open sharing of methods and data - ensures that research can be independently verified and built upon. Science thrives when it operates within a framework of trust, respect, and accountability, where findings can be tested and challenged. Only by adhering to these principles can researchers truly contribute to the body of knowledge.