Bacteria Cell Count
Estimate Number of Bacteria Cells
This part was a challenge to reproduce because for 3 reasons: a) The qPCR data is not available, b) the primers used for the amplicon sequencing and the qPCR differ, and c) relevant information is missing.
From the abstract, it is not clear if there are 108 16S gene copies per g apple or if there are 108 bacteria cells on an apple (see discussion below). I extracted mean gene copy number per g tissue from Figure 1 and multiplied it by the average weight of the corresponding tissue. The estimated (total) gene copies per apple are like the figures presented in the paper.
| source | organic | non-organic |
|---|---|---|
| My estimates | 1.2E+08 | 6.1E+07 |
| Wassermann et al. | 1.4E+08 | 4.2E+07 |
These numbers represent total counts and do not include co-amplification of non-bacteria targets! Although the authors acknowledge co-amplification they applied no correction.
Furthermore, qPCR results do not exclusively represent the viable bacterial community. source: Wassermann et al 2019
I used the amplicon data to get tissue specific correction factors for the qPCR results. This is not ideal because the authors used different primers for amplicon sequencing and qPCR. Nevertheless, it is useful to better understand the problem of co-amplification. I removed all OTUs associated with chloroplast or mitochondria. The results show tissue-specific co-amplification levels. An important but neglected fact in the paper!
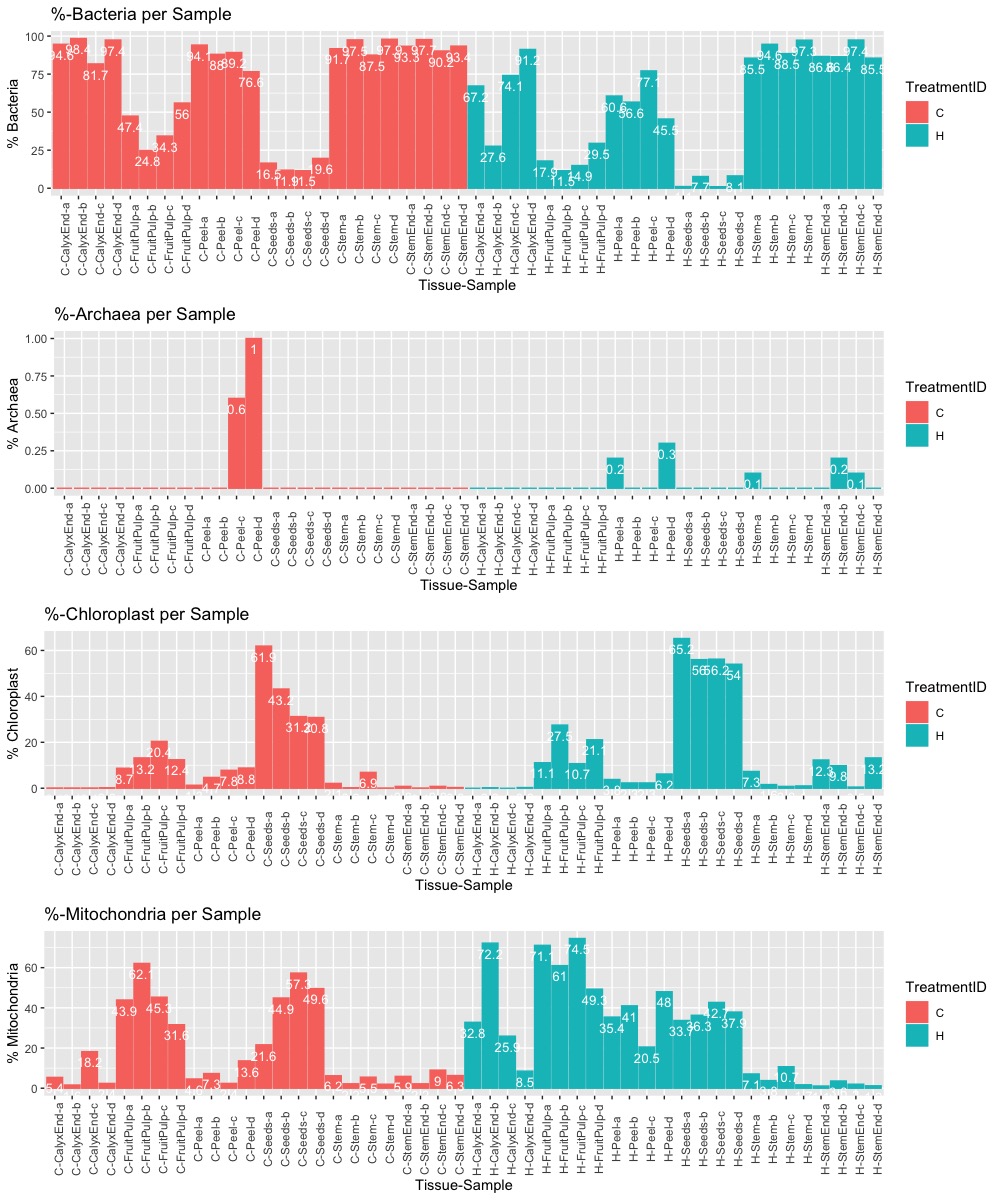 Figure: Percentage of bacteria, archaea, chloroplast, or mitochondria related OTUs. More details are provided below.
It turns out that co-amplification for mitochondrial and chloroplast 16S RNA is high in some samples. In interior tissue samples (e.g., seeds and pulp) it can reach up to 95%. Exterior tissue samples (e.g., calyx, peel, or stem) have lower levels of co-amplification.
# Median % Bacteria
 C-CalyxEnd C-FruitPulp      C-Peel     C-Seeds      C-Stem   C-StemEnd  H-CalyxEnd H-FruitPulp      H-Peel     H-Seeds      H-Stem   H-StemEnd
      96.00       40.85       88.60       14.20       94.60       93.35       70.65       16.40       58.60        4.40       91.55       86.50

# Median % Archaea
 C-CalyxEnd C-FruitPulp      C-Peel     C-Seeds      C-Stem   C-StemEnd  H-CalyxEnd H-FruitPulp      H-Peel     H-Seeds      H-Stem   H-StemEnd
       0.00        0.00        0.30        0.00        0.00        0.00        0.00        0.00        0.10        0.00        0.00        0.05

# Median % Mitochondria
 C-CalyxEnd C-FruitPulp      C-Peel     C-Seeds      C-Stem   C-StemEnd  H-CalyxEnd H-FruitPulp      H-Peel     H-Seeds      H-Stem   H-StemEnd
       3.90       44.60        5.95       47.25        3.85        6.10       29.35       66.05       38.20       37.10        5.45        1.60

# Mean % Chlorplast
 C-CalyxEnd C-FruitPulp      C-Peel     C-Seeds      C-Stem   C-StemEnd  H-CalyxEnd H-FruitPulp      H-Peel     H-Seeds      H-Stem   H-StemEnd
       0.10       12.80        6.25       37.20        1.15        0.55        0.10       16.10        3.05       56.10        1.30       11.05
Based on these results, I corrected the total counts.
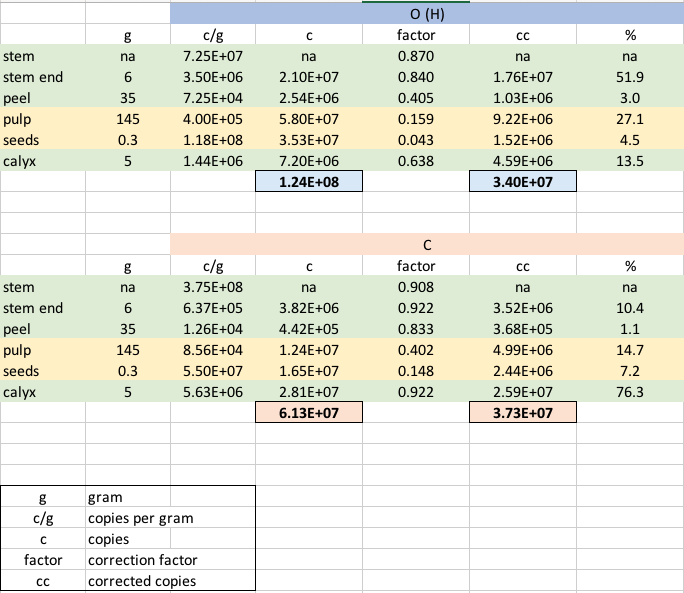
The difference between gene copy numbers of organic and non-organic apples disappears. Interestingly, exterior tissue samples (e.g., stem, calyx, peel) contribute (70% for organic and 80% for non-organic) more than interior tissue samples to the bacteria-specific 16S gene copy numbers. This is in direct contrsts to the authors claim that fruit pulp and seeds are hot spots.
Interestingly, fruit pulp and seeds were bacterial hot spots, while the peel was less colonized. source: Wasserman et al. 2019
Summary
I have serious doubts that the presented 16S gene copy numbers are correct. The reported numbers are total counts, including non-bacterial targets. The authors did not apply any correction to their calculations and overestimating the gene copy count. Furthermore, the different tissues show significant variation in the amount of co-amplification. A aother neglected fact with an interesting impact. Most bacteria, as expected, are found on external tissue samples like calyx or stem.
Conflicting Messages / Missing Clarity
Gene Copy Number
In the abstract and the results the authors report that there are 108 16S rRNA bacterial gene copy numbers in a gram of apple. A few sentences later in the abstract the authors guess that about 100 Million (108) bacterial cells are consumed together with an apple of 240g. This can only true if the average weight of an apple is 1g and number of 16S gene copies equals the number of bacteria. We know, both is not true.
In all, approximately 108 16S rRNA bacterial gene copy numbers were determined in each g apple. source: Wassermann et al. 2019
Our results suggest that we consume about 100 million bacterial cells with one apple. source: Wassermann et al. 2019
“Arlet” apples represent a relatively small apple variety; considering the standard size of an apple with 240 g, consuming the whole apple includes a mean uptake of 1.14 × 10^8 16S rRNA gene copy numbers. source: Wassermann et al. 2019
Gene Copy Number per Bacteria Genome
16S rRNA genes are not single copy genes. The copy numbers varies between and within bacteria species (e.g., Kembel et al 2012)!. I run a quick in-silico PCR using the same sequencing primers and the NCBI Bacteria genomes database as a reference. The reference contains in total 34,751 bacteria genome records. The in-silico PCR with maximal two mis-matches and an amplicons size-range restriction of min. 100nt and max. 2kb, produced 77,594 total and 17,044 unique hits. The copy number ranges from 1 (e.g., Mycobacteroides abscessus, NZ_AP014547) to maximal 37 (Tumebacillus avium, NZ_CP021434) with media of 4 copies per species (i.e., accession).
An apple carries about 100 million bacteria. Good luck washing them off. source: Frontiers Science News
Bacterial Cells per Apple
Based on the above presented corrected counts and the median of four 16S copies per bacteria, I believe an apple carries about 15 Million bacteria. If you like your apple with more bacteria just drop it. Otherwise wash the apple before you enjoy it. Most of the bacteria are actually found outside and not inside the apple.
OTUs related to Apple MT and CP
Again, the paper is unclear about what and how they removed non-bacteria related data. It is not clear if the authors removed only host related OTUs or all OTUs assigned to mitochondria and chloroplasts. It is also not clear at what step these OTUs were removed nor how much of the data was affected.
After taxonomy assignment, sequences assigned to host mitochondria and chloroplasts were discarded. source: Wassermann et al 2019
After removing chimeric, mitochondrial and chloroplast sequences, the overall bacterial community of all apple samples, assessed by 16S rRNA gene amplicon sequencing, contained 6,711,159 sequences that were assigned to 92,365 operational taxonomic units (OTUs). source Wassermann et al 2019
I used the same 16S reference (SILVA 16S v128) to predict taxa levels for the OTUs. The database contains apple related sequences but only CP and not MT.
## >ACYM01116125.1578.3000;tax=d:Bacteria,p:Cyanobacteria,c:Chloroplast,o:Malus_domestica_[apple],f:Malus_domestica_[apple],g:Malus_domestica_[apple],s:Malus_domestica_[apple];
## >ACYM01128596.6659.8128;tax=d:Bacteria,p:Cyanobacteria,c:Chloroplast,o:Malus_domestica_[apple],f:Malus_domestica_[apple],g:Malus_domestica_[apple],s:Malus_domestica_[apple];
The annotation would therefore not reveal any OTUs related to host MT. I therefore blasted the OTUs against apple MT and CP sequences from NCBI. I found 12 reliable hits for CP and 3 for MT.
| OTU | NCBI Accession | bitscore | Subject | Prevalence | TotalAbundance | RelativeAbundance |
|---|---|---|---|---|---|---|
| OTU1957 | NC_018554.1 | 396 | MT | 1 | 10 | 0.0001 |
| OTU1 | NC_018554.1 | 464 | MT | 48 | 591370 | 7.8381 |
| OTU1805 | NC_018554.1 | 414 | MT | 8 | 43 | 0.0006 |
| OTU3050 | MH595623.1 | 401 | CP | 1 | 6 | 0.0001 |
| OTU1160 | MH595623.1 | 412 | CP | 1 | 38 | 0.0005 |
| OTU2782 | MH595623.1 | 416 | CP | 6 | 8 | 0.0001 |
| OTU1600 | MH595623.1 | 429 | CP | 1 | 8 | 0.0001 |
| OTU1777 | MH595623.1 | 429 | CP | 10 | 778 | 0.0083 |
| OTU407 | MH595623.1 | 407 | CP | 31 | 2102 | 0.0199 |
| OTU2124 | MH595623.1 | 427 | CP | 6 | 34 | 0.0007 |
| OTU2771 | MH595623.1 | 422 | CP | 1 | 2 | 0.0000 |
| OTU538 | MH595623.1 | 433 | CP | 6 | 258 | 0.0019 |
| OTU2844 | MH595623.1 | 172 | CP | 1 | 2 | 0.0000 |
| OTU27 | MH595623.1 | 462 | CP | 48 | 337697 | 3.6604 |
| OTU2159 | MH595623.1 | 424 | CP | 19 | 42 | 0.0005 |
| Total | 932398 | 11.53 |
Contrary to the statement that PNAs blocks mitochondrial and plastid 16S rRNA, PNAs clamps reduce co-amplification. A fact also noted by the authors with no further discussion.
OTUs related to MT or CP
In my annotation, 53 OTUs were assigned to Chloroplast (at class level) and 301 OTUs were assignment to Mitochondria (at family level). The most frequent CP-OTUs are plant or likely algae related. Sequence similarity searches with Blast and NCBI-nt database confirmed these results. Many of the MT-OTUs are (most likely) fungi related sequences. I also confirmed these results with Blast searches. Since the study focuses on bacteria, I remove everything associated with CP and MT.
qPCR and PNAs
In Material and Methods there is no mentioning of a PNAs used to reduce co-amplification during qPCR. There is a note in the description of Figure 1 saying the it was used. I assume it was used but it is not clear!
Primer Citation
...the primers 515f – 806r (Caporaso et al., 2010) were used to amplify the 16S rRNA gene... source: Wassermann et al. 2019
For determining bacterial abundance, qPCRs were conducted with the bacterial directed primer pair 515f – 927r (10 μm each; Köberl et al., 2011). source: Wassermann et al. 2019
The names for the qPCR primer are misleading and wrongly cited. The reader gets the impression only a different reverse primer was used while in fact a shorter version of the forward primer was used.
Amplicon PCR primer (Caporaso et al., 2011)
515f GTGCCAGCMGCCGCGGTAA
806r GGACTACHVGGGTWTCTAAT

qPCR primer (Lieber 2002, Schwieger and Tebbe 1998)
Uni-Bac515f GTGCCAGCAGCCGC
Uni-Bac927r CCCGTCAATTYMTITGAGTI
While the first citation is wrong the second citation is problematic. Köberl et al (2011) is not the original source of the primer and seems to only serve the purpose of yet another last-author self-citation. This remark is supported by the 20% self-citations (11 out of 54) in this publication.
Table 1: SE or SD
The results presented in table 1 are not clear to me. Mostly because I do not understand the values after the plus-minus sign. Is it standard deviation (SD) or standard error (SE)? What "standard" was used (Brown 1982)? It this table not redundant considering Figure 1?
Figure 1: Error Bars
What am I looking at, "SD error bars", "SEM error bars", or "Confidence interval error bars"? To read and understand Figure 1 would need to know!
Extras
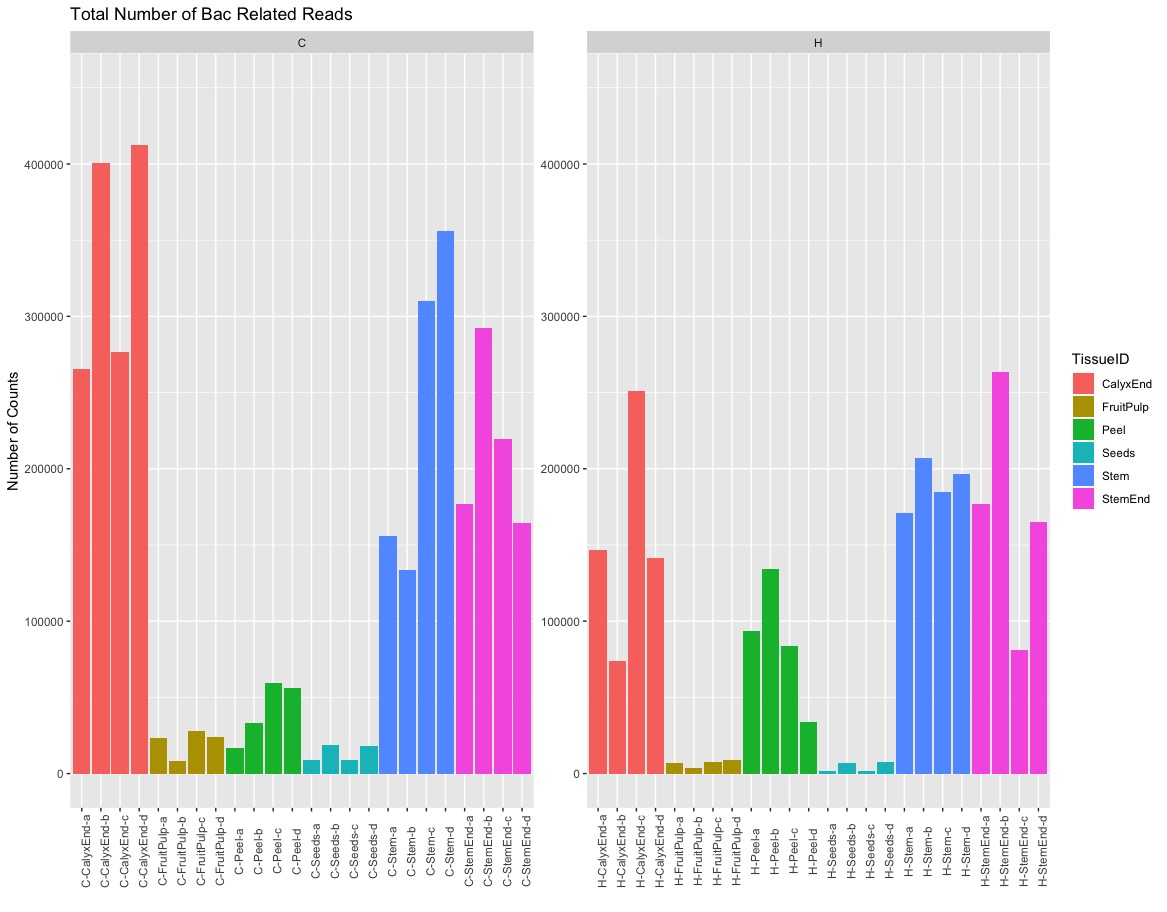
Sequencing Depth per Sample (Bacteria only)
After removing all non-bacteria related OTUs the number of counts varies between tissue. Seeds and fruit pulp have the lowest number of counts compare to all the other sampels.
Percentage of bacteria, archaea, chloroplast, or mitochondria related OTUs in numbers.
| TissueID | TreatmentID | SID | pBAC | pARC | pCP | pMT |
|---|---|---|---|---|---|---|
| Stem | H | EX | 85.5 | 0.1 | 7.3 | 7.1 |
| Stem | H | EX | 94.6 | 0.0 | 1.6 | 3.8 |
| Stem | H | EX | 88.5 | 0.0 | 0.8 | 10.7 |
| Stem | H | EX | 97.3 | 0.0 | 1.0 | 1.7 |
| Stem | C | EX | 91.7 | 0.0 | 2.1 | 6.2 |
| Stem | C | EX | 97.5 | 0.0 | 0.2 | 2.2 |
| Stem | C | EX | 87.5 | 0.0 | 6.9 | 5.5 |
| Stem | C | EX | 97.9 | 0.0 | 0.1 | 2.0 |
| StemEnd | H | EX | 86.6 | 0.0 | 12.3 | 1.1 |
| StemEnd | H | EX | 86.4 | 0.2 | 9.8 | 3.6 |
| StemEnd | H | EX | 97.4 | 0.1 | 0.5 | 2.0 |
| StemEnd | H | EX | 85.5 | 0.0 | 13.2 | 1.2 |
| StemEnd | C | EX | 93.3 | 0.0 | 0.8 | 5.9 |
| StemEnd | C | EX | 97.7 | 0.0 | 0.1 | 2.2 |
| StemEnd | C | EX | 90.2 | 0.0 | 0.8 | 9.0 |
| StemEnd | C | EX | 93.4 | 0.0 | 0.3 | 6.3 |
| Peel | H | EX | 60.6 | 0.2 | 3.8 | 35.4 |
| Peel | H | EX | 56.6 | 0.0 | 2.3 | 41.0 |
| Peel | H | EX | 77.1 | 0.0 | 2.3 | 20.5 |
| Peel | H | EX | 45.5 | 0.3 | 6.2 | 48.0 |
| Peel | C | EX | 94.1 | 0.0 | 1.3 | 4.6 |
| Peel | C | EX | 88.0 | 0.0 | 4.7 | 7.3 |
| Peel | C | EX | 89.2 | 0.6 | 7.8 | 2.4 |
| Peel | C | EX | 76.6 | 1.0 | 8.8 | 13.6 |
| FruitPulp | H | IN | 17.9 | 0.0 | 11.1 | 71.1 |
| FruitPulp | H | IN | 11.5 | 0.0 | 27.5 | 61.0 |
| FruitPulp | H | IN | 14.9 | 0.0 | 10.7 | 74.5 |
| FruitPulp | H | IN | 29.5 | 0.0 | 21.1 | 49.3 |
| FruitPulp | C | IN | 47.4 | 0.0 | 8.7 | 43.9 |
| FruitPulp | C | IN | 24.8 | 0.0 | 13.2 | 62.1 |
| FruitPulp | C | IN | 34.3 | 0.0 | 20.4 | 45.3 |
| FruitPulp | C | IN | 56.0 | 0.0 | 12.4 | 31.6 |
| Seeds | H | IN | 1.1 | 0.0 | 65.2 | 33.7 |
| Seeds | H | IN | 7.7 | 0.0 | 56.0 | 36.3 |
| Seeds | H | IN | 1.0 | 0.0 | 56.2 | 42.7 |
| Seeds | H | IN | 8.1 | 0.0 | 54.0 | 37.9 |
| Seeds | C | IN | 16.5 | 0.0 | 61.9 | 21.6 |
| Seeds | C | IN | 11.9 | 0.0 | 43.2 | 44.9 |
| Seeds | C | IN | 11.5 | 0.0 | 31.2 | 57.3 |
| Seeds | C | IN | 19.6 | 0.0 | 30.8 | 49.6 |
| CalyxEnd | H | EX | 67.2 | 0.0 | 0.0 | 32.8 |
| CalyxEnd | H | EX | 27.6 | 0.0 | 0.2 | 72.2 |
| CalyxEnd | H | EX | 74.1 | 0.0 | 0.0 | 25.9 |
| CalyxEnd | H | EX | 91.2 | 0.0 | 0.3 | 8.5 |
| CalyxEnd | C | EX | 94.6 | 0.0 | 0.1 | 5.4 |
| CalyxEnd | C | EX | 98.4 | 0.0 | 0.1 | 1.6 |
| CalyxEnd | C | EX | 81.7 | 0.0 | 0.1 | 18.2 |
| CalyxEnd | C | EX | 97.4 | 0.0 | 0.2 | 2.4 |