Microbiota Structure
My re-analysis of the bacterial community structure does not correspond with the authors' results, and I have difficulty following several of their conclusions. Relevant details are, in a number of cases, missing from the discussion in ways that affect the conclusions drawn.
Taxonomic Composition
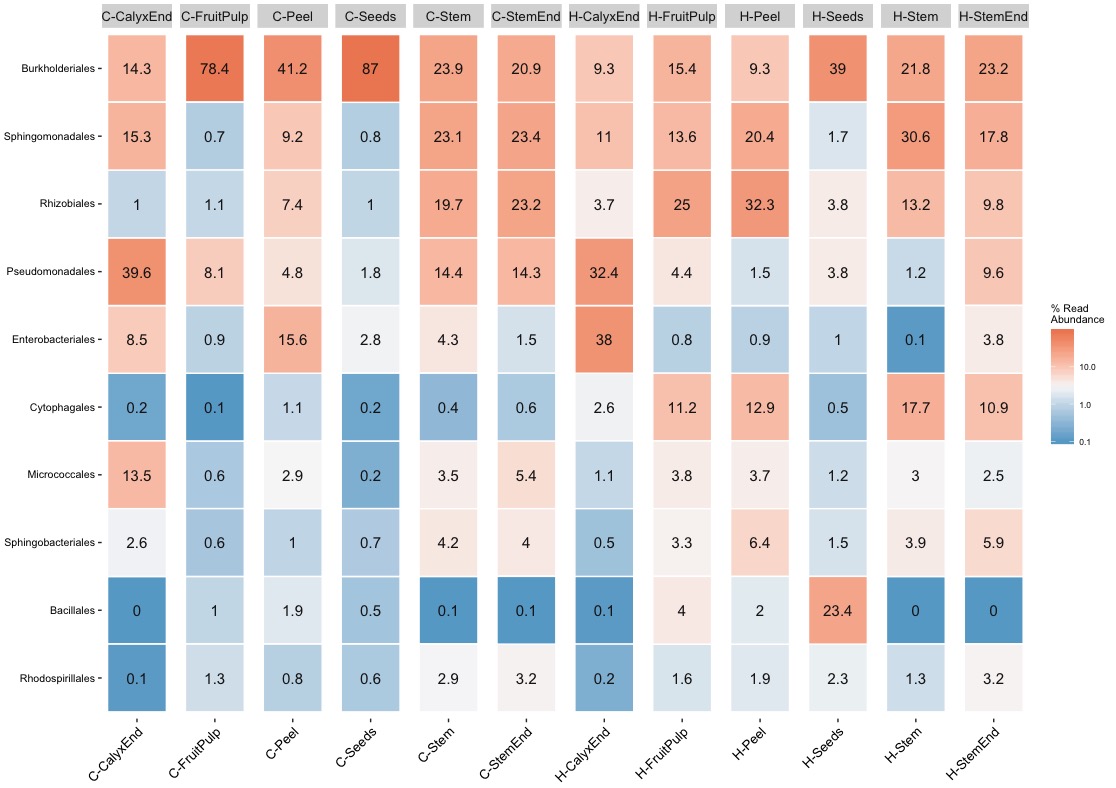
The order-level heatmap below provides the reference data for the Burkholderiales, Ralstonia, and Enterobacteriales sections that follow.
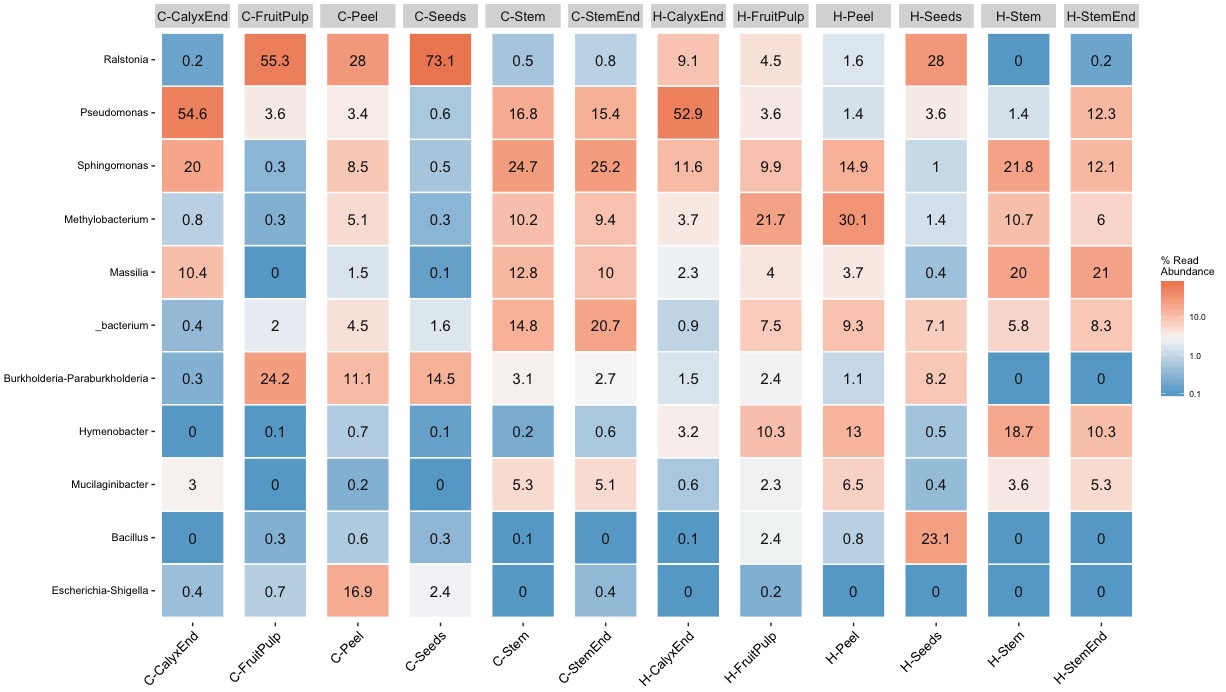
The genus-level heatmap below shows abundance by treatment and tissue, used as a reference for the Lactobacillus and Other Overlooked Genera sections.

Burkholderiales
The discussion of taxonomic composition in the paper is selective, and this creates a misleading impression. The authors claim Burkholderiales dominates conventional apples, but omit a relevant detail.
Conventional apple microbiota was furthermore found to be less even constructed and highly dominated by Burkholderiales, accounting to almost 43% abundance. source: Wassermann et al. 2019
Observation
Burkholderiales is indeed more abundant on average in non-organic (45.5%) than organic (20.2%) apples. This average is driven almost entirely by fruit pulp (78.4%) and seeds (87%) of non-organic apples. Stem and stem end show essentially no difference between treatments (C: 23.9%/20.9%; H: 21.8%/23.2%). The paper's own Supplementary Table 1 gives dataset-wide values of 16.71% (Organic) vs. 42.67% (Conventional) from their independent pipeline, broadly consistent in direction and scale with the values found here despite the different OTU clustering (see Data Preparation).
Interpretation
Reporting Burkholderiales dominance as a general property of conventional apples, without noting that it is concentrated in just two of six tissues, overstates how broadly this pattern applies. This is a case, however, where two independent analyses agree on the direction and rough scale of the overall effect, unlike some of the other taxa discussed below.
Ralstonia
Observation
There is a single OTU assigned to Ralstonia, most abundant on average in fruit pulp, peel, and seed samples of conventional apples (fruit pulp 55.3%, seeds 73.1%, peel 28%). However, the highest single-sample abundance I found, around 80%, was in one seed sample of an organic apple, even though the organic seed group average (28%) is much lower.
Interpretation
A single high-abundance replicate can noticeably shift a group average without the group as a whole reflecting that pattern; this is the same pooling issue raised elsewhere on this site, here visible directly in one taxon.
Observation
Ralstonia does not appear at all in the paper's own Supplementary Table 1, which lists the 67 genera found to differ significantly in dataset-wide abundance between organic and conventional apples.
Interpretation
By the paper's own genus-level significance test, Ralstonia's overall abundance difference between treatments did not reach statistical significance. This makes the Discussion's framing of Ralstonia as a taxon that "prevailed in conventional apples" harder to reconcile with the paper's own supplementary results, on top of the single-outlier-driven average already noted above.
Enterobacteriales
I do not see why Enterobacteriales should be considered a signature taxon of conventional apples.
The order Enterobacteriales was one of the signature taxa of conventional apples as well; among them, we would like to highlight the almost ubiquitous occurrence of OTUs assigned to Escherichia-Shigella in the tissues of conventional apples (although low abundant) and their absence in organically managed apples. source: Wassermann et al. 2019
Observation
Overall Enterobacteriales abundance is similar between non-organic (5.8%) and organic (7.5%) apples. Broken down by tissue, it reaches 38% in organic calyx end samples, but only 8.5% in conventional calyx end samples, where it is not even the most abundant order (Pseudomonadales is, at 39.6%).
Interpretation
Enterobacteriales dominance in calyx end tissue does not hold for both treatments equally, which is at odds with treating it as a signature taxon of the conventional group specifically.
Significant differences in abundance between microbiota of organically and conventionally managed apples were furthermore calculated on higher taxonomic level. The 172 genera were condensed to 66 different bacterial orders; among them, 25 orders were significantly different abundant [...] the orders Burkholderiales, Pseudomonadales, Enterobacteriales, and Flavobacteriales prevailed in conventional apples. source: Wassermann et al. 2019, Results
Observation
Supplementary Table 1 gives the actual dataset-wide values behind this claim: 5.19% (Organic) vs. 5.41% (Conventional), with the Kruskal-Wallis/FDR test marking this as statistically significant.
Interpretation
Statistically significant is not the same as substantial. A ~4% relative difference (5.19% vs. 5.41%) being labeled as an order that "prevailed" in conventional apples, in the same sentence as Burkholderiales, which shows a genuinely large difference (16.71% vs. 42.67% dataset-wide, see Burkholderiales above), treats a marginal and a large effect with the same language. Passing a significance test across a large, multiple-testing-corrected panel of orders does not by itself indicate a meaningful or biologically important effect size.
The paper's own Figure 6 gives a genus-level breakdown of Enterobacteriales across all twelve tissue-treatment groups:
Figure 6: Comparison of conventional and organic apple tissues regarding Enterobacteriales abundance. Color code for bubbles is depicted in the legend on the left and bubble size indicates relative abundance of taxa within total Enterobacteriales microbiota. The abbreviations O and C denote for organically and conventionally managed apple tissues, respectively. source: Wassermann et al. 2019

Observation
Escherichia-Shigella appears in this figure only in Stem C, Seeds C, and Calyx End C, three of six conventional tissues, and in none of the six organic tissues. Pantoea and Tatumella are visibly present across nearly every column in both treatments, and appear to be the more consistently abundant genera within Enterobacteriales overall, a pattern the paper's text does not discuss. Erwinia appears as a single small bubble in Calyx End C only, consistent with the finding from the raw OTU table (see Taxonomic Network) that Erwinia occurs in exactly 1 of 48 samples, a single conventional calyx-end replicate.
Erwinia
This is a genuinely rare find.
"Abundance of a not further assigned Enterobacteriaceae taxon (Enterobacteriaceae sp. in Figure 6), Erwinia and Escherichia-Shigella were significantly more abundant in conventional apples." source: Wassermann et al. 2019
Observation
Erwinia is absent from the defined "core" microbiota entirely, and I was only able to find it in a single calyx sample from one conventional apple.
One more detail worth noting: the paper's citation for this claim, "Pirhonen et al., 2018," refers to a study focused on Erwinia carotovora subsp. carotovora that was published in 1993, not 2018.
Escherichia-Shigella
What does it actually mean for Escherichia-Shigella to be "significantly more abundant" on conventional apples?
"Escherichia-Shigella were significantly more abundant in conventional apples." source: Wassermann et al. 2019
Reducing abundance data to presence/absence is a risky simplification for a relatively rare organism like Escherichia-Shigella.
Observation
Escherichia-Shigella is present in nearly all conventional samples except stem, and absent from organic apples except for two fruit pulp samples. This matches the general pattern described in the paper. However, abundance is low across nearly all of these samples, with the exception of three conventional peel replicates. Repeating the rarefying step multiple times, I could only confirm a stable result for conventional peel samples specifically.
Interpretation
Presence/absence matches the paper's description, but the underlying abundance pattern is far more concentrated, and far less stable under repeated rarefying, than "significantly more abundant" suggests.
Lactobacillus
I am uncomfortable with the "health claim" implied for organic apples as a source of probiotic bacteria.
"Controversially, Lactobacillus, which is frequently used within probiotics, was one of the core taxa of organic apples." source: Wassermann et al. 2019
Observation
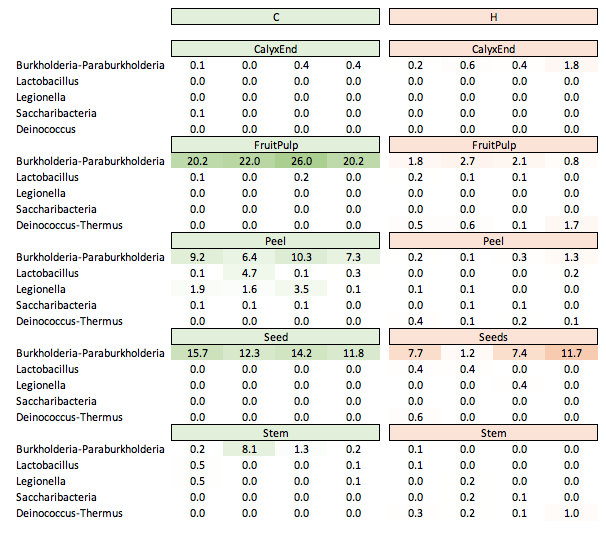
Lactobacillus is very rare overall: counts range from 0 to 70, with a total abundance of 0.2%. The highest abundance found, 6.6% in the "core" dataset and 4.7% after rarefying, occurs in a single conventional peel replicate (C-Peel-b). Because it is so rare, its presence/absence is sensitive to the rarefying step, and it was never found in all four biological replicates of any group.

Observation
Like Ralstonia above, Lactobacillus does not appear anywhere in the paper's own Supplementary Table 1 of genera with significantly different dataset-wide abundance between treatments.
Interpretation
By the paper's own significance criteria, there is no statistically supported treatment difference for Lactobacillus either. Calling it "one of the core taxa of organic apples" in the Discussion, given both this and the single-replicate pattern already noted above, rests on narrative emphasis rather than the paper's own statistical results.
Interpretation
This pattern does not support describing Lactobacillus as a core taxon of organic apples specifically; if anything, its single highest reading is in a conventional sample.
Other Overlooked Genera
Observation
Legionella shows a pattern similar to Escherichia-Shigella: both occur above 1.5% abundance on the same three conventional peel replicates, and are far lower in organic peel samples.
Unknown
Burkholderia-Paraburkholderia, Deinococcus-Thermus (also discussed under Alpha Diversity), and Saccharibacteria are present in the data shown above but are not discussed in the paper at all. Whether their absence from the discussion reflects a deliberate scope decision or an oversight is not something this re-analysis can determine.
Figure 5 — Taxonomic Composition Pie Charts
Figure 5: Taxonomic composition of organic and conventional apple tissue microbiota. Pie charts visualize taxa occurring in the core microbiomes of each tissue, with at least 0.1% abundance in the whole dataset, and visualize differences between conventional and organic apples. source: Wassermann et al. 2019

Observation
Figure 5 defines "core" as taxa with at least 0.1% abundance in the whole dataset, with no stated prevalence requirement. This is a third, different "core" definition from the two already found on Figure 4 (see Taxonomic Network): that figure's caption requires both 75% replicate prevalence and 0.01% abundance, while its own Results text drops the prevalence requirement entirely. Figure 5 uses a tenfold higher abundance threshold (0.1%) than either version of Figure 4's definition, and states no prevalence criterion at all.
Interpretation
Three different operational definitions of "core microbiome," used across two figures in the same paper without reconciling them, makes it difficult to know what claim about the "core" is actually being made at any given point, or to compare figures against each other with any confidence.
Observation
Each pie chart pools all four biological replicates of a tissue-treatment group into a single average composition. Stem, StemEnd, and CalyxEnd, the three tissues shown on Beta Diversity to have poorly resolved, heavily intermixed replicates under hierarchical clustering, are exactly the tissues where these pooled pie charts show the most visually distinct organic-versus-conventional compositions.
Interpretation
This is consistent with what pooling does rather than a contradiction: averaging across replicates removes the within-group variation that the hierarchical clustering on Beta Diversity showed to be substantial for these three tissues. A pooled pie chart can look like a clean treatment effect precisely because the replicate-level noise behind it has been averaged away, not because the underlying replicates agree with each other.
Observation
The Conventional Seeds pie chart is dominated by a single color corresponding to Ralstonia. This matches the pattern already discussed on Bacteria Cell Count and Microbiota Structure: Ralstonia is highly abundant on average in conventional seeds, though the single highest abundance found anywhere in the dataset (around 80%) is actually in one organic seed sample, not a conventional one.
Summary
Rarefying is a random process that affects the presence/absence and abundance of rare taxa. The authors pool biological replicates throughout the paper, which, as shown above, obscures substantial within-replicate variation. I consider this pooling problematic in two ways: biological replicates are pooled to increase apparent diversity, and tissues are pooled to find differences between treatments. Whether a rare taxon occurs in one replicate or in all four matters for how much weight its presence should carry. It is worth knowing that potentially harmful bacteria occur on non-organic apples, but this is of limited practical use for health-related questions on its own: most Escherichia-Shigella species are harmless, and the more relevant practical question is whether such organisms can be washed off or are embedded within the fruit itself.
Intra-Sample Variation for Top 30 OTUs
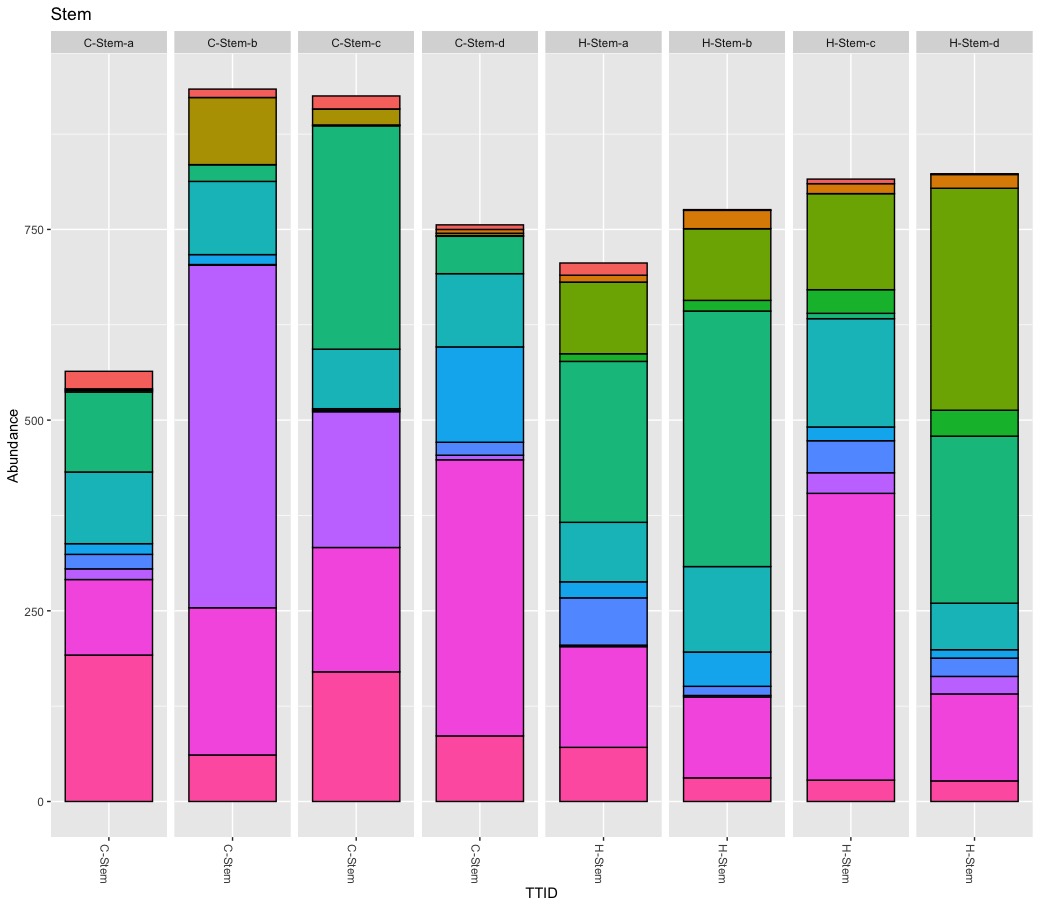
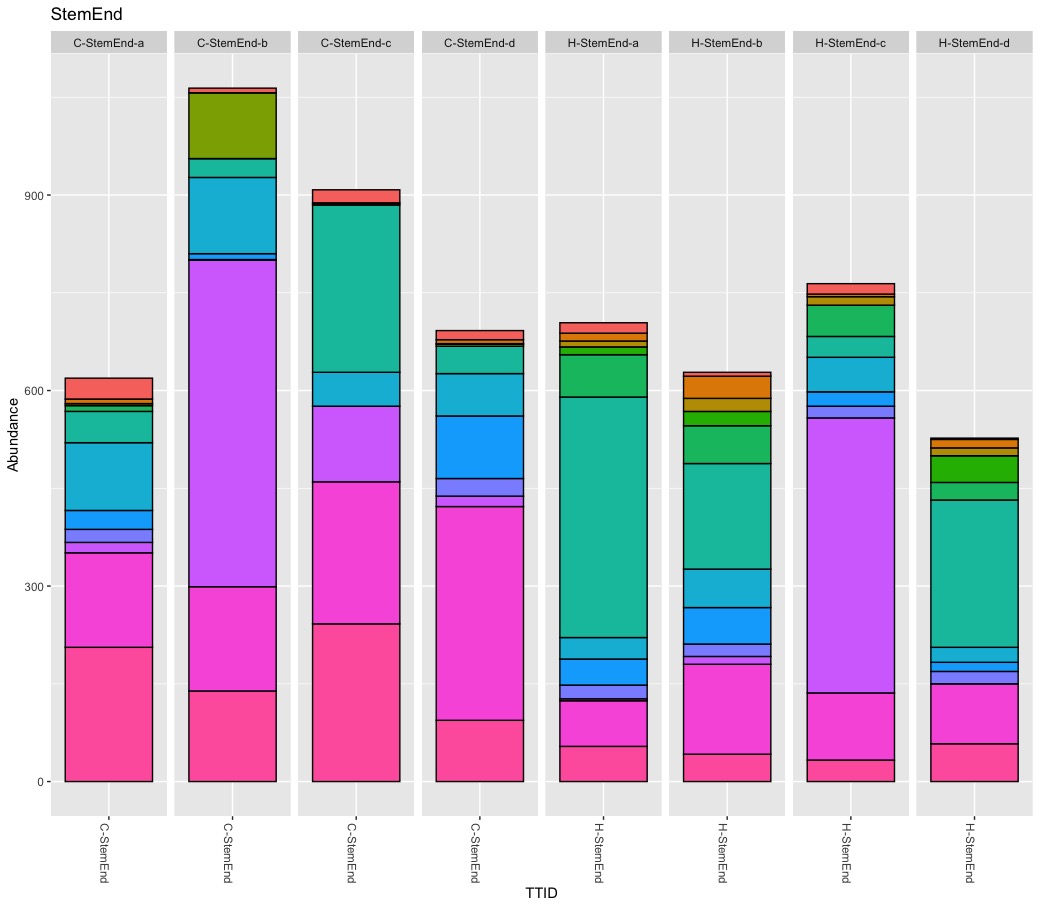
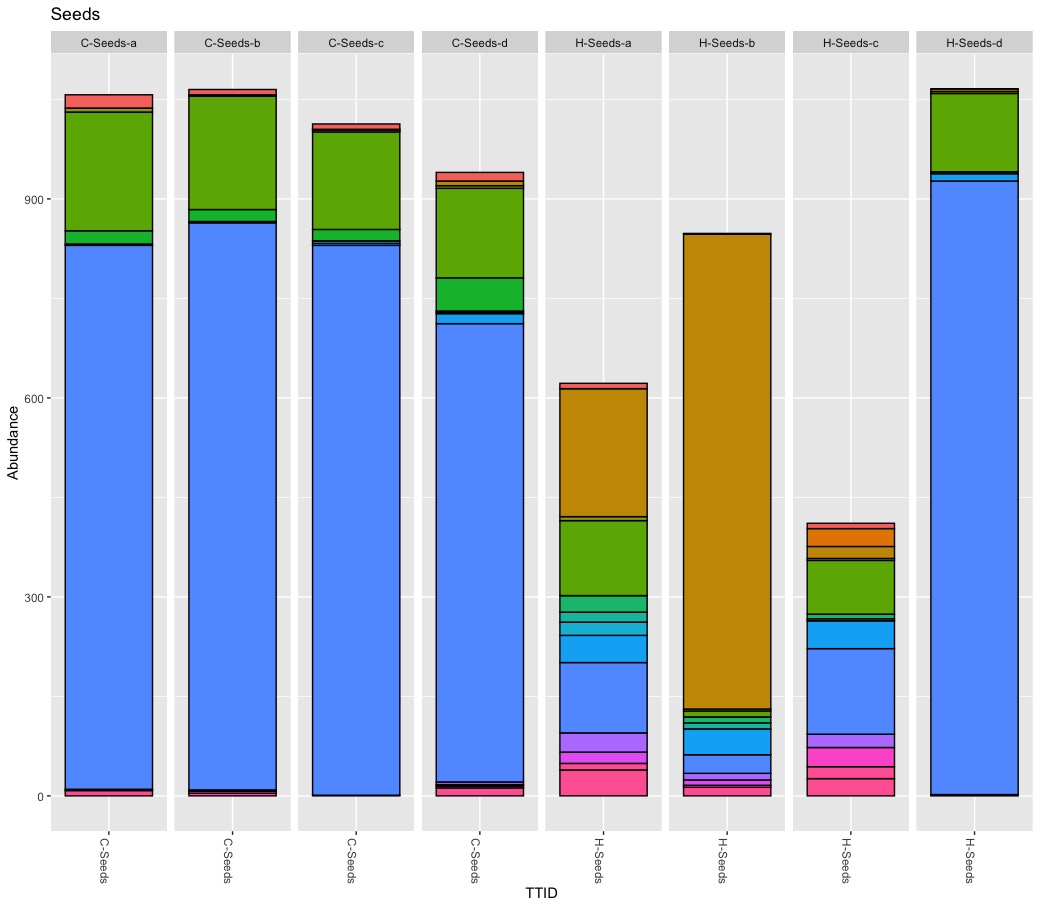
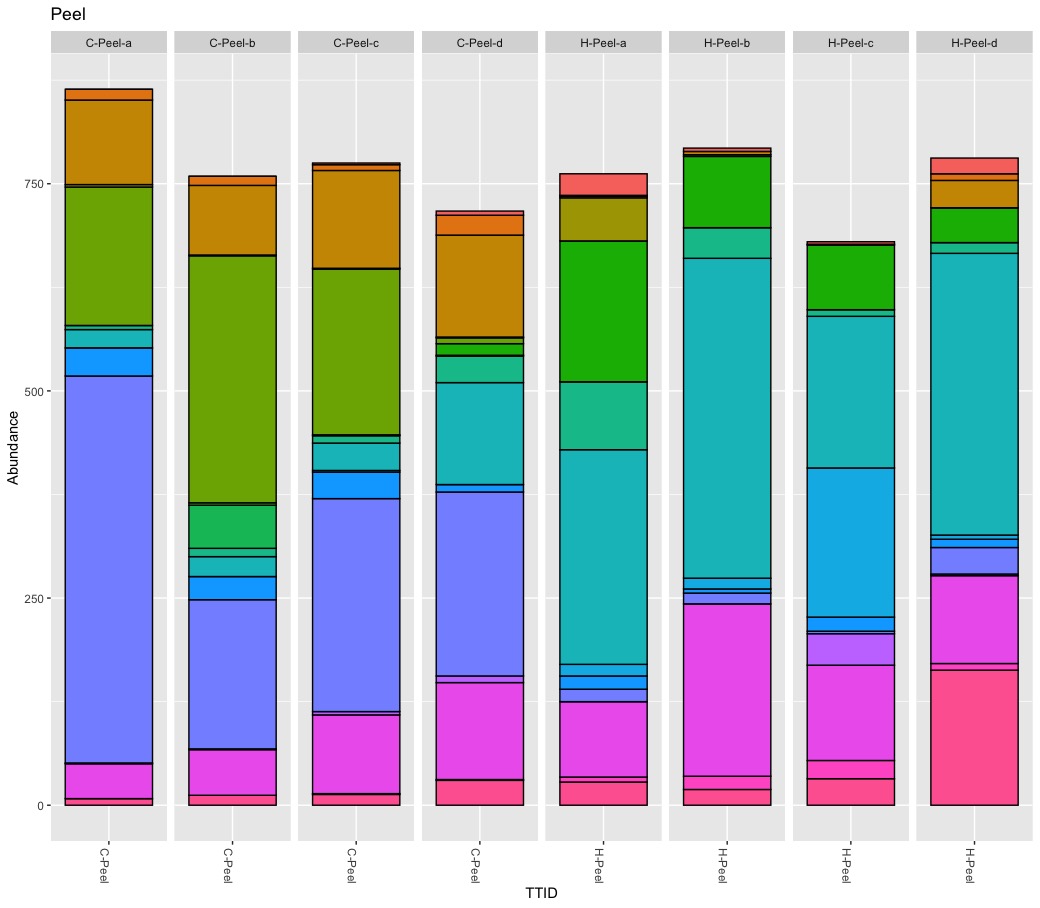
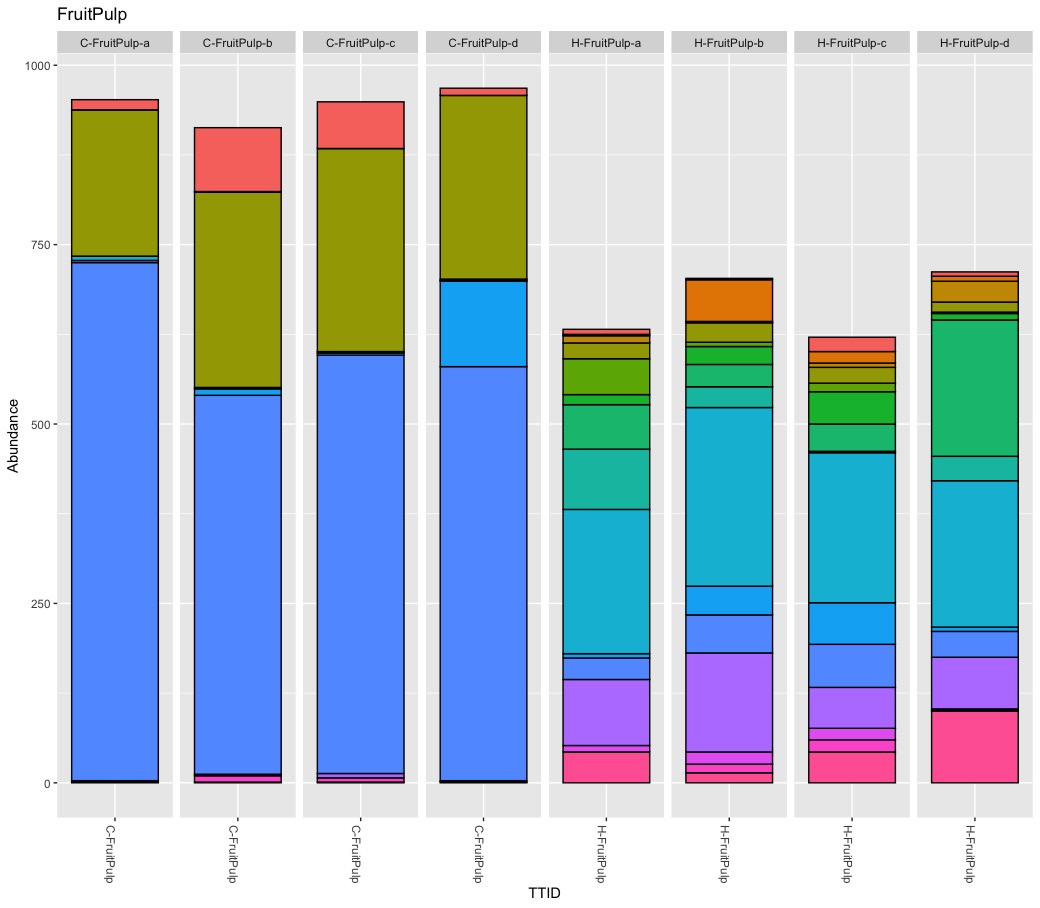
The following genus-level composition plots show the top 30 OTUs for each of the four biological replicates per tissue and treatment, illustrating how much variation exists at the level of individual apples rather than group averages.
Observation
Stem replicates show substantial compositional variation within both treatments. Notably, C-Stem-b is dominated by a single taxon not prominent in the other three conventional replicates.
Unknown
C-StemEnd-b shows a similar single-taxon dominance pattern to C-Stem-b. If replicate letters correspond to the same individual apple across tissues, this would suggest one specific conventional apple has an atypical microbiota across multiple exterior tissues, rather than the variation being independent from tissue to tissue.
Observation
Conventional (C-Seeds) replicates are compositionally similar to each other, each dominated by the same taxon. Organic (H-Seeds) replicates vary considerably: H-Seeds-b is dominated by a different single taxon than H-Seeds-a, c, and d, and total read counts also vary more within this group.
Interpretation
This matches the unusually high Shannon diversity standard deviation already noted for H-Seeds on the Alpha Diversity page (SD = 1.680): the organic seed replicates are not just noisier in their diversity index values, they visibly differ in which taxa dominate.
Observation
Within each treatment, replicates split into two compositional patterns rather than forming a single group: C-Peel-a and C-Peel-c share a similar dominant taxon, while C-Peel-b and C-Peel-d differ from them. Likewise, H-Peel-b, c, and d share a dominant taxon, while H-Peel-a differs from the other three.
Interpretation
Peel replicates do not form a single, uniform compositional group within either treatment. This is consistent with the broader pattern on this page: high within-tissue variability tends to be driven by a subset of replicates, not the whole group equally.
Observation
Conventional (C-FruitPulp) replicates are highly consistent with each other, all dominated by the same single taxon. Organic (H-FruitPulp) replicates show a much more even, multi-taxon composition with no single dominant group, and are consistent with each other in this respect.
Interpretation
This matches the Shannon diversity table on the Alpha Diversity page, where fruit pulp shows the lowest within-group variability of any tissue for both treatments (C: SD = 0.078; H: SD = 0.065), despite the two treatments having very different diversity levels overall (C mean = 2.15; H mean = 4.29). A single dominant taxon corresponds to low diversity in conventional samples; a more even, multi-taxon composition corresponds to high diversity in organic samples; and each pattern is itself highly reproducible across replicates.
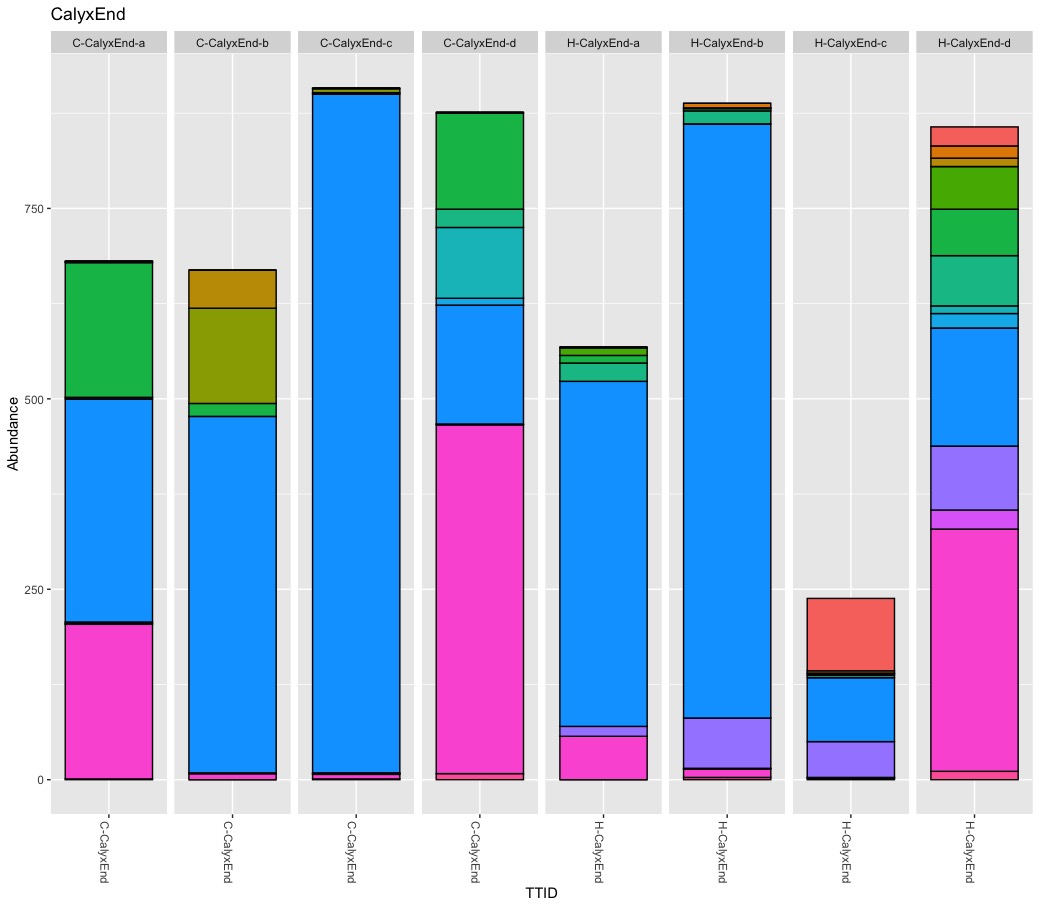
Observation
Calyx end shows the least consistent composition of any tissue: replicates within both treatments differ substantially from one another, with no single dominant taxon shared across all four replicates in either group. H-CalyxEnd-c also has a visibly lower total read count than its sibling replicates.
Interpretation
This matches the Alpha Diversity page, where calyx end has the lowest mean Shannon diversity of any tissue in both treatments, alongside a comparatively high standard deviation for organic calyx end (SD = 0.992). Both the diversity estimates and the raw composition point to calyx end being the least stable tissue in this dataset.
Interpretation
Across nearly every tissue, individual replicates differ substantially in composition, not just abundance. This level of within-group variation is difficult to reconcile with the confidence of the tissue- and treatment-level claims made throughout the paper.