Alpha Diversity (retake)
Diversity Estimates of Apple Microbiota
Rarefaction
I think rarefy the counts without removing samples with low coverage is dangerous. By downsampling the data to the lowest count a lot of the data can be removed.
OTU tables were rarefied to 1,525 sequences per sample, according to the sample with lowest amount of sequences. source: Wassermann et al. 2019
After removing chimeric, mitochondrial and chloroplast sequences, the overall bacterial community of all apple samples, assessed by 16S rRNA gene amplicon sequencing, contained 6,711,159 sequences that were assigned to 92,365 perational taxonomic units (OTUs). source: Wassermann et al. 2019
1,525 * 48 = 73,200 (~1.1% of the data)
After removing chloroplast and mitochondria related OTUs the number of sequences drops from 7,936,016 to 5,629,907. The sample sum ranges from 1,354 to 412,743. I also remove about 99% of the data.
1,354 * 48 = 64,992 (~1.1% of the data)
In general, I think it is not a bad idea to rarefy the data but only if
- sample(s) with low counts are removed
- we are not specifically interested in rare taxa
- diversity is low (e.g., rarefaction curve with plateau)
Number of OTU and taxonomic assignment
As reported in data preparation, my estimated number of OTUs is much lower despite having used the same applications (i.e., usearch). I cannot explain the difference because the authors do not specify their approach well enough. I have troubles to understand what they did. What are representative sequences? What is an open reference SILVA database? Was the annoation done before clustering?
Representative sequences were aligned, open reference database SILVA (ver128_97_01.12.17) was used to pick operational taxonomic units (OTUs) and de novo clustering of OTUs was performed using usearch. source: Wassermann et al. 2019
Table: Number of unique taxa per level.
| Wassermann et al. 2019 | All | Rarefied | |
|---|---|---|---|
| OTUs (bacteria) | 92365 | 2738 | 1040 |
| Phylum | 44 | 34 | 29 |
| Class | na | 86 | 72 |
| Order | 325 | 132 | 108 |
| Family | na | 246 | 195 |
| Genus | 1755 | 463 | 286 |
| Species | na | 63 | 30 |
Table: OTU with missing taxa at different levels.
| Tax Level | All | Rarefied |
|---|---|---|
| Pylum | 355 (13%) | 115 ( 4%) |
| Class | 444 (16%) | 151 ( 6%) |
| Order | 557 (20%) | 207 ( 8%) |
| Family | 729 (27%) | 287 (10%) |
| Genus | 1091 (40%) | 476 (17%) |
| Species | 2041 (75%) | 1018 (37%) |
Rarefaction
Rarefying data is a random process. Therefore, it is a good practice to provide the random seed number. Rarefying data to a low number can lead to arbitrary presence or absence of rare OTUs. A fact largely ignored by the authors. The study contains biological replicates but does not filter for prevalence. On the contrary, the authors pools the replicates and focuses on presence-absence (e.g., Unweighted UniFrac).
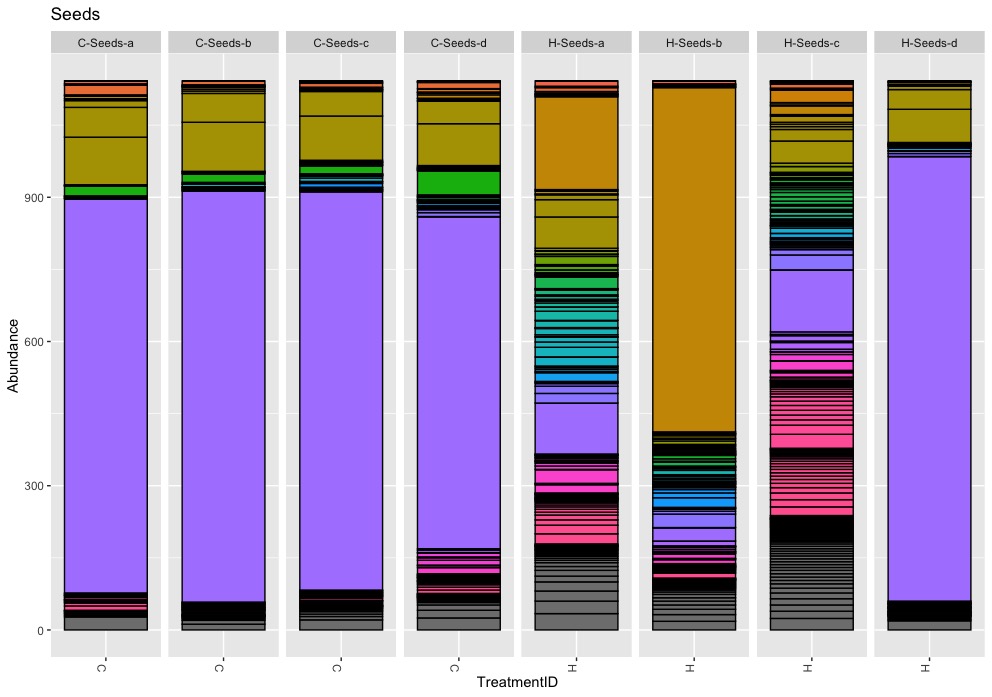
Mean Abundances
I can confirm the reported overall mean abundances at phyla level. But I do neither understand the meaning nor the relevance of this numbers. Instead of pooling all samples together, I prefer to keep treatments, tissues or even samples separate to better understand the bacteria composition.
Among bacterial phyla, Proteobacteria highly dominated with 80%, followed by Bacteroidetes (9%), Actinobacteria (5%), and Firmicutes (3%).
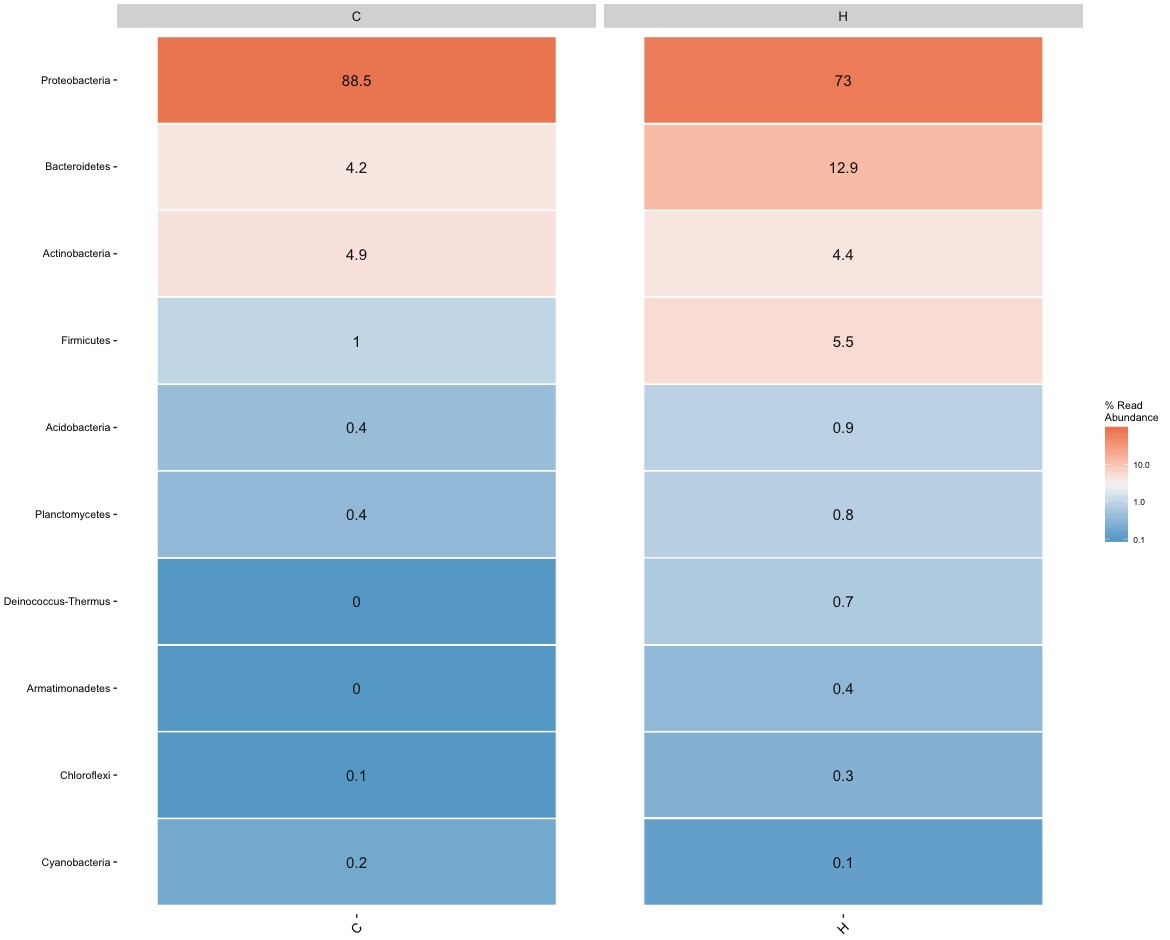
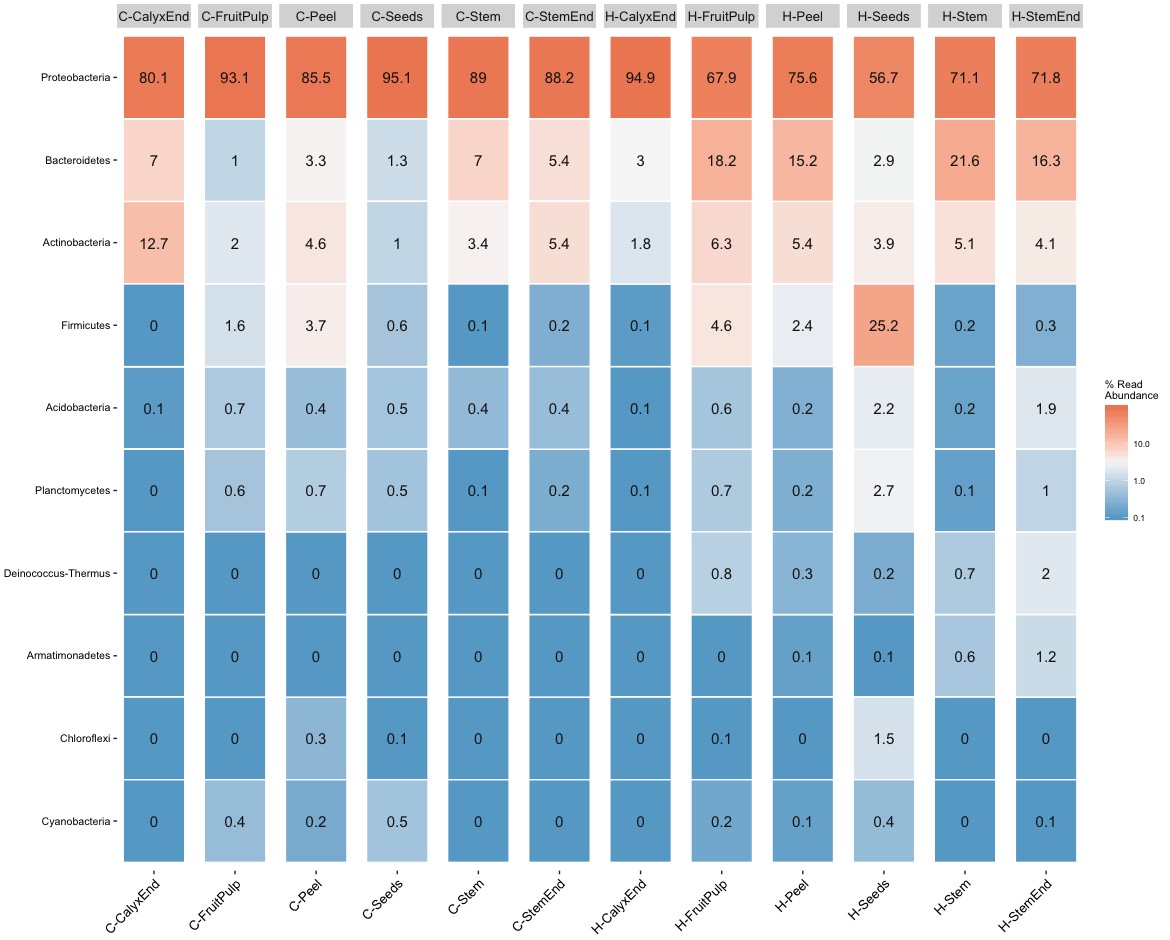
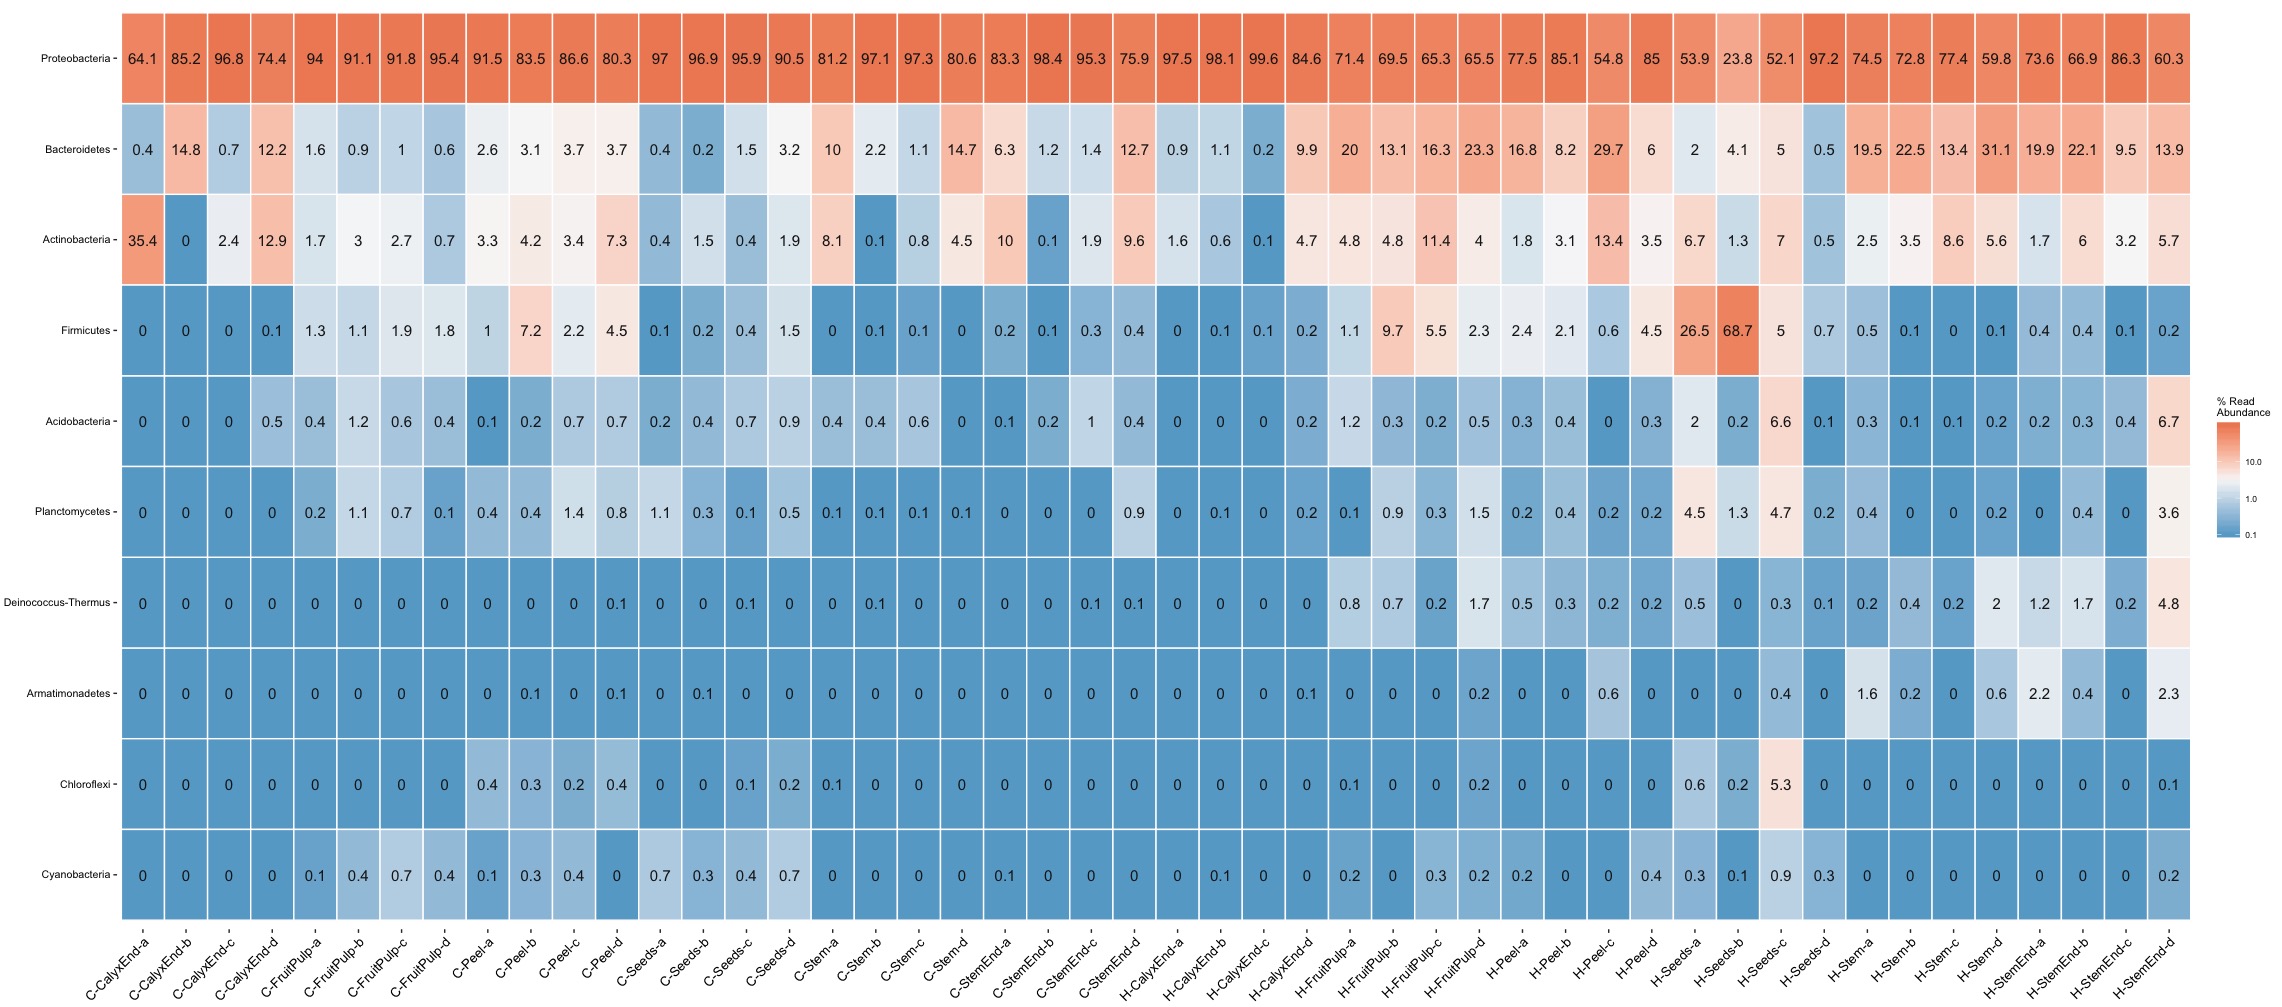
The heat maps confirm the high abudance of Proteobacteria but they also show tissue-specific differences and more importantly illustrate high levels of inter-replicates variation. For example, Firmicutes is a frequent phyla in organic seed samples. A closer look at sample level reveals that the abundance within replicates ranges from 4.5% up to 68.7% with an average of 25.2%. A similar example is Actionbacteria. Its abundance within replicates ranges from 0% up to 35.4% with a mean of 12.7%.
It is not all Black and White
The heat maps illustrate nicely the problematic of pooling replicates but it also idicates the problem of using quantitative (presence/absence) distance meassures. For example, Deinococcus-Thermus, a bacteria known to be resistant to environmental hazards, is present in stem samples of commercial as well as organic apples. The important difference, Deinococcus-Thermus was found only one (0.1%) of four replicates of commercial apples while it was found in all four replicates (0.2%-2%) of organic apples. A detail lost in quantitativ comparisons.
Alpha Diversity - Shannon
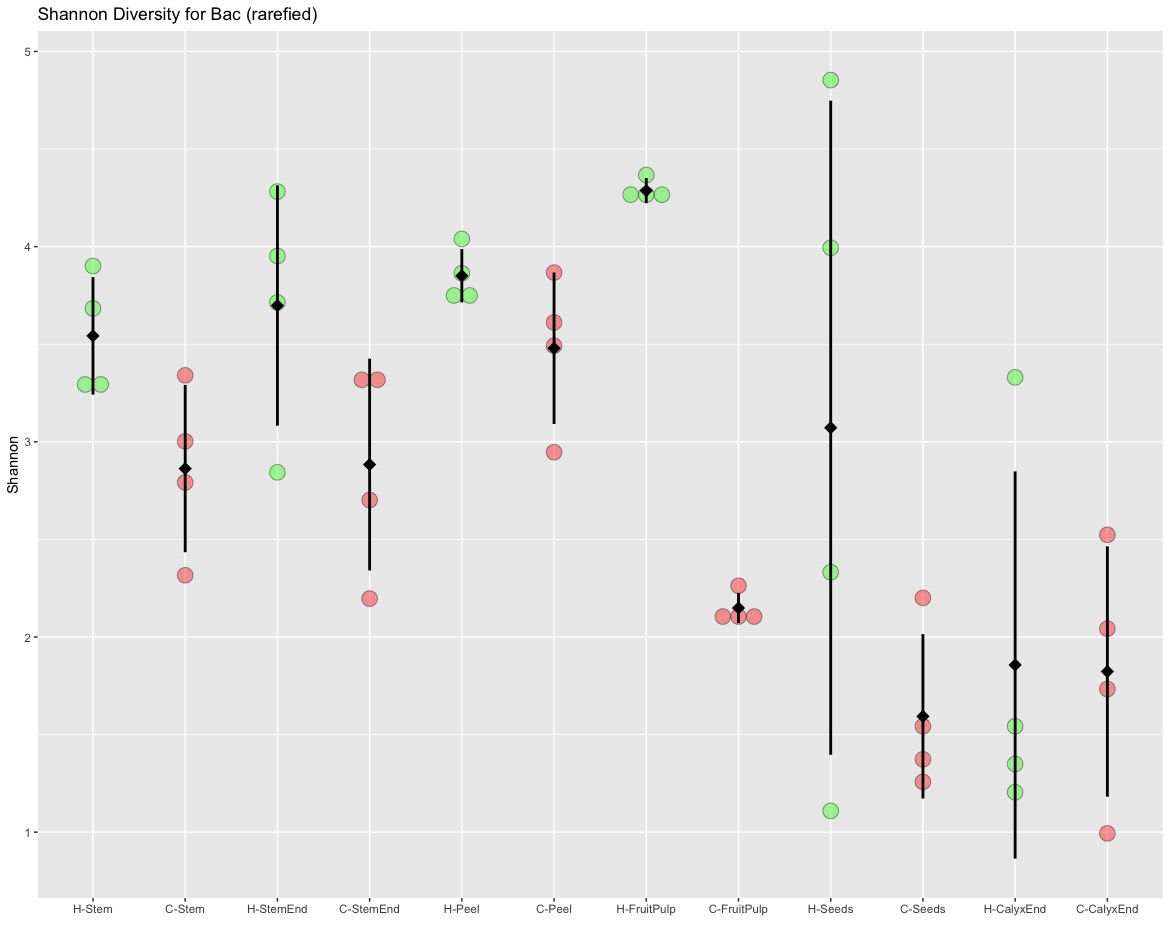
I could not reproduce most of the results based on the alpha diversity estimates. I am not using a box plot because we have less the minimum required 5 data points. I only have four data points and therefore I am using a scatterplot. There might be something wrong with Figure 2 (see below). I would also not pool samples from different tissues because they derived from the same apple and are therefore not independent. My tissue specific scatterplot look similar to the box plots but only the comparison between fruit pulp is significant.
Shannon diversity index was significantly higher for the microbiota of all organic tissues, compared to conventional ones, with the sole exception of calyx end microbiota. source: Wassermann et al 2019
I agree with the authors to use a non-parametric Kruskal–Wallis test but for the pairwise comparisons I would either adjust the p-values or better use a specific test for multiple comparisons (e.g., Dunn test). Neither the pairwise comparison (uncorrected p-values) nor Dunn test (corrected p-values) support the results presented in Table 2.
## Shannon Estimates:
# TTID        count  mean    sd
# H-Stem          4  3.54 0.301
# C-Stem          4  2.86 0.429
# H-StemEnd       4  3.70 0.615
# C-StemEnd       4  2.88 0.543
# H-Peel          4  3.85 0.137
# C-Peel          4  3.48 0.388
# H-FruitPulp     4  4.29 0.065
# C-FruitPulp     4  2.15 0.078
# H-Seeds         4  3.07 1.680
# C-Seeds         4  1.59 0.421
# H-CalyxEnd      4  1.86 0.992
# C-CalyxEnd      4  1.82 0.642

## Tukey multiple pairwise-comparisons (normal distribution, homogeneity of variance)
# Comparison                      diff          lwr           upr     p adj
# H-Stem-C-Stem            0.612362542 -0.999688352  2.2244134359 0.9698586 NS
# H-StemEnd-C-StemEnd      0.736269424 -0.875781470  2.3483203177 0.9001011 NS
# H-Peel-C-Peel            0.255833294 -1.356217600  1.8678841881 0.9999881 NS
# H-FruitPulp-C-FruitPulp  2.067299808  0.455248914  3.6793507021 0.0036659 **
# H-Seeds-C-Seeds          1.427953597 -0.184097296  3.0400044914 0.1239836 NS
# H-CalyxEnd-C-CalyxEnd   -0.022423124 -1.634474018  1.5896277698 1.0000000 NS

## Dunn test for multiple comparisons (equal numbers of observations)
# Comparison                          Z      P.unadj       P.adj
# C-Stem - H-Stem           -0.78286822 0.4337045002 0.584173408 NS
# C-StemEnd - H-StemEnd     -1.26269068 0.2067003645 0.389777830 NS
# C-Peel - H-Peel           -0.27779195 0.7811720712 0.859289278 NS
# C-FruitPulp - H-FruitPulp -3.18198052 0.0014627166 0.024134824 *
# C-Seeds - H-Seeds         -1.94454365 0.0518299272 0.155489782 NS
# C-CalyxEnd - H-CalyxEnd   -0.07576144 0.9396088937 0.968971672 NS

## Nemenyi test for multiple comparisons (unequal numbers of observations)
# Comparison              mean.rank.diff   pval
# H-Stem-C-Stem                     9.25 0.9988
# H-StemEnd-C-StemEnd              13.25 0.9741
# H-Peel-C-Peel                     4.00 1.0000
# H-FruitPulp-C-FruitPulp          31.75 0.0601 .
# H-Seeds-C-Seeds                  19.50 0.7142
# H-CalyxEnd-C-CalyxEnd             0.25 1.0000
Significantly Different
I could not reproduce the figures nor was I able to confirm the divergences found in comparing alpha diversity measures. The authors report that all tissue specific comparisons are significantly different, with calyx end being the only exception. In my comparisons, I could only find a difference between organic and non-organic in fruit pulp samples. The reason for most comparisons not being significant is likely to be explained by the high level of variation within replicates.
Problems
Figure 2 - Shannon diversity estimates
There is something fundamentally wrong with Figure 2. (a) There are only 4 data points (4 replicates/apples) per sample but some of the box plots (e.g., Peel O, Fruit pulp O and C, Seeds C, Calyx end O) show multiple outliers. This I do not understand!
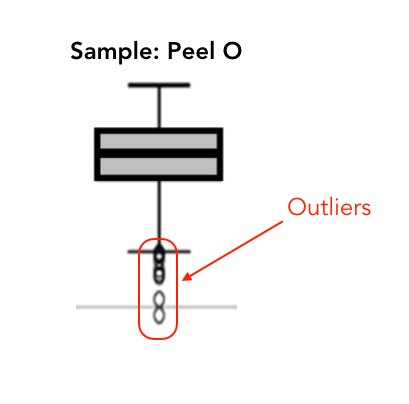
I also think the combined analysis (left) is not correct. The different tissues originated from the same apples and are therefore not independent.
Table 2 - Pair-wise comparison of Shannon diversity estimates
Since the data is most likely not normally distributed (see R script) I am in support of an non-parametric test (Kruskal–Wallis). What I do not understand is why the Authors would run multiple Kruskal–Wallis on all pairwise comparisons and not adjusting the p-values? If a Kruskal–Wallis test is significant, a post-hoc analysis for multiple comparisons could be performed (e.g., Dunn test).