Beta Diversity (retake)
Beta Diversity
The authors used unweighted UniFrac distance. Calculating UniFrac distances requires a phylogenetic tree. This was neither provided nor was the method described. I used Muscle to create multiple sequence alignment.
Beta diversity, based on unweighted UniFraq distance matrix, was visualized by Principle Coordinates Analysis (PCoA) and statistical significance was calculated by Analysis of Similarity (ANOSIM). source: Wassermann et al. 2019
I failed to reproduce Figure 3. It is difficult to see any clusters and plotting ellipses for treatments at confidence level 95% did not help.
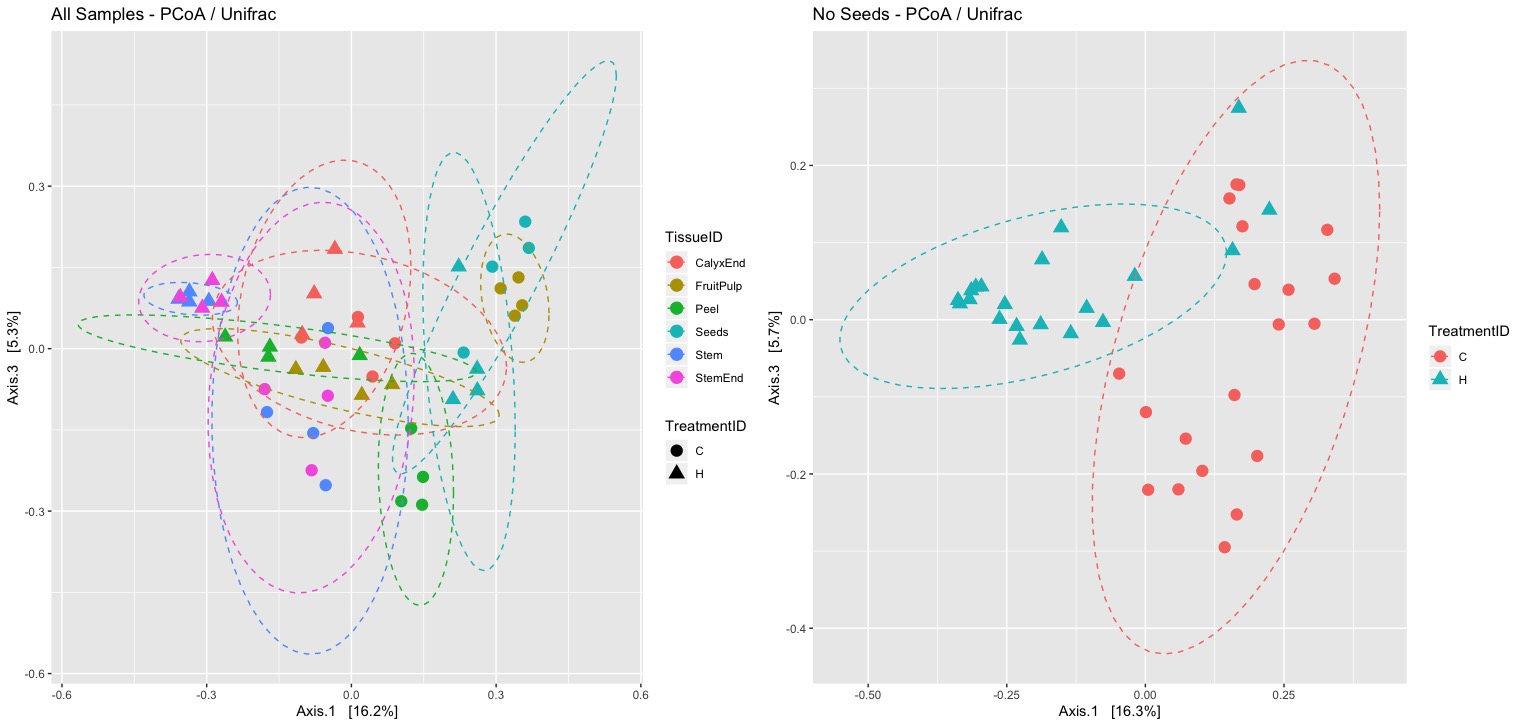
My main concern is the low percentage of variation that is explained by the first three axis. It would be much better if Weighted Unifrac would be used instead.
Explained Variance using PCoA with Unweighted Unifrac
=> PCA 1&2 = 29.0%
=> PCA 1&3 = 21.6%
=> PCA 1-3 = 34.3%

Explained Variance using PCoA with Weighted Unifrac
=> PCA 1&2 = 58.0%
=> PCA 1&3 = 48.7%
=> PCA 1-3 = 67.4%
I also failed to confirm all the results of the analysis of similarities. Not only tissue Seeds but also CalyxEnd were not significantly different between treatments. Unweigthed UniFrac is a qualitativ distance metric giving rare taxa equal weight compare to more abundant taxa. Interestingly, when I consider abundance (Weighted UniFrac) non of the pairwise comparisons is significant any more.
The data indicates a significant difference between location (inside/outside) of the tissue. An interesting finding, relevant for the interpretation of the results.
ANOSIM Results (Wassermann et al. 2019)

Tissue              : R = 0.80, p = 0.001
Treatment           : R = 0.26, p = 0.001
Treatment no Seeds  : R = 0.45, p = 0.001

Management effect on each tissue separately (Wassermann et al. 2019)
All tissue no seeds : R > 0.8, p < 0.05
Seeds alone         : R = 0.4, p = 0.05

ANOSIM Results (My Results)

Tissue              : R = 0.53, p = 0.001
Treatment           : R = 0.28, p = 0.001
Treatment no Seeds  : R = 0.40, p = 0.001
Treatment-Tissue    : R = 0.78, p = 0.001
Inside/outside      : R = 0.51, p = 0.001

ANOSIM Results Tissue Specific Pairwise Treatment (My Results)
(p-values without multiple-hypothesis correction)

Stem      : R = 0.99; p = 0.031
StemEnd   : R = 0.88; p = 0.029
Peel      : R = 0.83; p = 0.022
FruitPulp : R = 1.00; p = 0.036
Seeds     : R = 0.21; p = 0.126
CalyxEnd  : R = 0.46; p = 0.059

Multilevel Pairwise Comparison using adonis (Permanova)
(p-value correction method: Benjamini-Hochberg)

# Unweigthed UniFrac

                           Df SumsOfSqs   F.Model         R2 p.value p.adjusted sig
H-Stem vs C-Stem            1 0.5785735 3.4661078 0.36615976   0.030 0.04096552   .
H-StemEnd vs C-StemEnd      1 0.5630496 3.0985516 0.34055438   0.030 0.04096552   .
H-Peel vs C-Peel            1 0.5117392 2.2376209 0.27163436   0.032 0.04096552   .
H-FruitPulp vs C-FruitPulp  1 0.6023229 3.0952419 0.34031441   0.030 0.04096552   .
H-Seeds vs C-Seeds          1 0.3455386 1.3945509 0.18859170   0.061 0.06493548
H-CalyxEnd vs C-CalyxEnd    1 0.3542998 1.6847801 0.21923596   0.063 0.06600000

# Weigthed UniFrac

                           Df SumsOfSqs    F.Model         R2 p.value p.adjusted sig
H-Stem vs C-Stem            1 0.1866470  3.3325662 0.35709001   0.025 0.05250000
H-StemEnd vs C-StemEnd      1 0.1871960  2.8463682 0.32175557   0.026 0.05250000
H-Peel vs C-Peel            1 0.5025782 10.6873377 0.64044594   0.022 0.05250000
H-FruitPulp vs C-FruitPulp  1 0.7930154 30.1887011 0.83420239   0.034 0.05250000
H-Seeds vs C-Seeds          1 0.3537613  3.6847942 0.38047212   0.143 0.15472131
H-CalyxEnd vs C-CalyxEnd    1 0.1389192  1.1419600 0.15989449   0.197 0.20315625
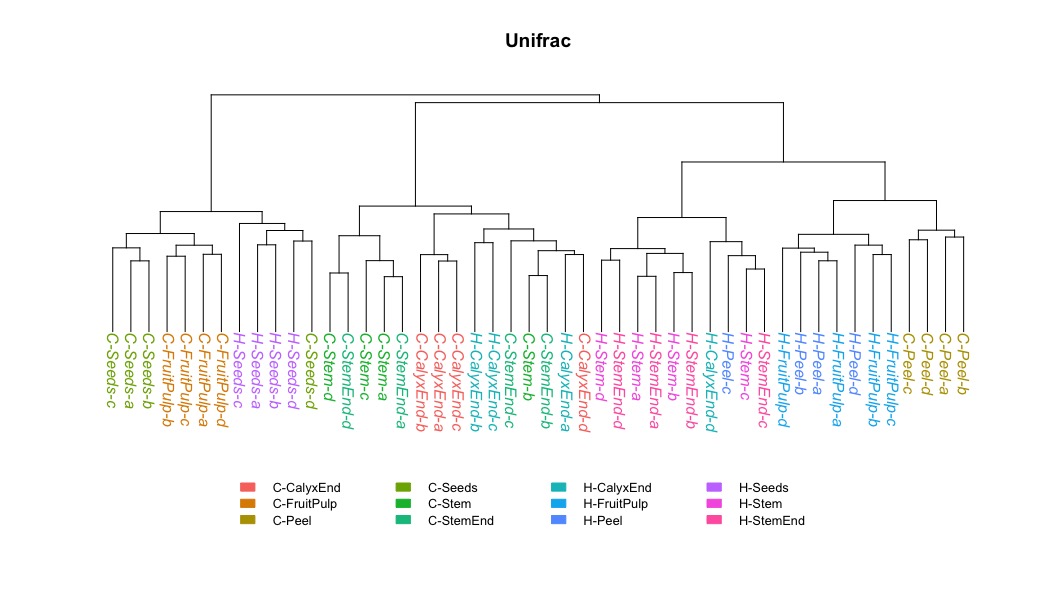
Maybe a hierarchical clustering can help to better understand data structure.
Problems
Ellipses in Figure 3
I am not sure what method or confidence level the authors used to draw the ellipses. I had to decrease the confidence level from default of 0.95 to 0.6 to get similar narrow ellipses.