Amplicon-Sequencing

Lecture Note
⬇︎ Amp-Seq
Amplicon sequencing is based on the PCR amplification of a small fragment of a hypervariable genomic region. 16S and internal transcribed spacer (ITS) are common amplicons used to identify and compare bacteria or fungi communities within samples. Both ITS and 16S rRNA gene sequencing are well-established methods for comparing sample phylogeny and taxonomy from complex environmental samples. For convenience, I will divide Amp-Seq data workflow into two major steps:
➜ Data Processing - The computationally more demanding technical part where the raw reads are being converted into OTUs count tables.
➜ Data Analysis - Where we focus on the biological interpretation of the data.
Data Processing
Data processing can further divided into individual processing steps. Every Amp-Seq dataset is different and the workflow to process the data needs to take this into account. A fixed workflow would be convenient but will not work.
We work on the GDC server gdcsrv2 for the following terminal exercises.
Get Ready
## Prepare Working-directory
mdkir ${HOME}/MDA20/AmpSeq
cd ${HOME}/MDA20/AmpSeq

## Download Data
wget "http://gdc-docs.ethz.ch/GeneticDiversityAnalysis/GDA20/data/SP05_R1.fastq.gz"
wget "http://gdc-docs.ethz.ch/GeneticDiversityAnalysis/GDA20/data/SP05_R2.fastq.gz"

## Verify download
md5sum SP05_R[12].fastq.gz
# 2eeb689f8aadf31a5a47ada426830b6a  SP05_R1.fastq.gz
# c2961865c37078ede0903a1332bd36f0  SP05_R2.fastq.gz
Paired Read Merging
There are many program available to help you with merging the paired-end reads. This is an important step because it can also help with error correction in the overlapping region. We use FLASh, a simple but fast way to merge reads.
## Merge Reads - FLASh (default)
flash SP05_R1.fastq.gz SP05_R2.fastq.gz --threads 1
| FLASh Default | Stats |
|---|---|
| Total reads | 10,000 |
| Combined reads | 4,583 |
| Uncombined reads | 5,417 |
| Percent combined | 45.8% |
The first default read-merging run with FLASh worked but the merging success of 46% seems low. We modifiy the parameters to imporve the merging.
## Merge Reads
flash SP05_R1.fastq.gz SP05_R2.fastq.gz --threads 1 \
      --min-overlap 8 --max-overlap 260 \
      --max-mismatch-density 0.45
## Help for FLASh
flash --help | less
| Flash | Stats |
|---|---|
| Total reads | 10,000 |
| Combined reads | 5,397 |
| Uncombined reads | 4,603 |
| Percent combined | 54.0% |
A bit better but still not very good. We could further decrease the mismatch density or the minimum overlap but we would also lower the merging quality. Instead of a brute-force approach let us apply what we have learned in the QC lecture.
We know that the read quality drops with read length. Meaning we expect more errors at the end of a read. Let us trim the "bad" read-ends to improve merging. For this task we are using fastp a tool you are already familiar with from the QF exercises.
## Trim Read and Remove short Reads
fastp --max_len1 240 \
      -i SP05_R1.fastq.gz -I SP05_R2.fastq.gz \
      -o SP05_R1_trim.fastq.gz -O SP05_R2_trim.fastq.gz
| fastp | Stats |
|---|---|
| Reads before | 10,000 |
| Reads after | 9,884 |
| Reads filtered | 116 |
Careful with fastp! Have a closer look at the report. We are losing additional reads because of quality filtering (mean Q >= 15) and bases are removed becasue adaptor trimming is enabled by default. Let us turn both off and focus on read end trimming only. In addtion we include a min read length filter.
## Trim Read and Remove short Reads
fastp --max_len1 240 --length_required 100 \
      --disable_adapter_trimming \
      --disable_quality_filtering \
      -i SP05_R1.fastq.gz -I SP05_R2.fastq.gz \
      -o SP05_R1_trim.fastq.gz -O SP05_R2_trim.fastq.gz
| fastp | Stats |
|---|---|
| Reads before | 10,000 |
| Reads after | 9,996 |
| Reads filtered | 0 |
## Merge Trimmed Reads
flash SP05_R1_trim.fastq.gz SP05_R2_trim.fastq.gz
| FLASh default | Stats |
|---|---|
| Total reads | 9,996 |
| Combined reads | 9,667 |
| Uncombined reads | 329 |
| Percent combined | 96.7% |
It looks much better than the previous default FLASh run. Most read-pairs are merging now with the default settings of FLASh.
Challenge - Can you find evem better parameter setting to further improve merging?
We know that R1 and R2 reads are different in the expected error profile. Because R2 has an overall lower quality and drops faster we could apply different trimming for R1 and R2.
  ## Trim Reads and Remove short Reads
  fastp --max_len1 200 --max_len2 180 --length_required 100 \
        --disable_adapter_trimming \
        --disable_quality_filtering \
        -i SP05_R1.fastq.gz -I SP05_R2.fastq.gz \
        -o SP05_R1_trim.fastq.gz -O SP05_R2_trim.fastq.gz
  ## FastQC
  #fastqc SP05_R1_trim.fastq.gz SP05_R2_trim.fastq.gz
  ## Merge Trimmed Reads
  flash SP05_R1_trim.fastq.gz SP05_R2_trim.fastq.gz
  # N(total)=  10,000
  # N(filter)=  9,996
  # N(merged)=  9,836 (98.4%)
fasfp and discovered that enabling adaptor trimming improves merging too.
  ## Trim Read and Remove short Reads
  fastp --max_len1 240 --length_required 100 \
        --disable_quality_filtering \
        -i SP05_R1.fastq.gz -I SP05_R2.fastq.gz \
        -o SP05_R1_trim_test.fastq.gz -O SP05_R2_trim_test.fastq.gz
  ## Merge Trimmed Reads
  flash SP05_R1_trim_test.fastq.gz SP05_R2_trim_test.fastq.gz
  # N(total)=  10,000
  # N(filter)=  9,996 plus 44141 trimmed bases
  # N(merged)=  9,667 (96.7%)
fastp but how does it work? The QC reports show no signs of adaptor contamination. What is fasfp really doing? Despite the good results. It is dangerous to use a method if you do not know what it exactly does.
By default, the adaptor trimming will trim of read ends based on paired-read overlap analysis. This might not be an excellent idea for overlapping paired-end amplicon data? It would also trim reads differently, which at the end might create biases.
We get higher merging rates by increase max mismatches in the overlap. It works, but is it a good idea?
  ## Trim Read and Remove short Reads
  fastp --max_len1 240 --length_required 100 \
        --disable_adapter_trimming \
        --disable_quality_filtering \
        -i SP05_R1.fastq.gz -I SP05_R2.fastq.gz \
        -o SP05_R1_trim_test.fastq.gz -O SP05_R2_trim_test.fastq.gz
  ## Merge Trimmed Reads
  flash SP05_R1_trim_test.fastq.gz SP05_R2_trim_test.fastq.gz --max-mismatch-density 0.5
  # N(total)=  10,000
  # N(filter)=  9,996
  # N(merged)=  9,869 (98.7%)
It is not always easy to figure out the best possible parameters or data preparation strategy. It might help to run QC before and after you have manipulated the reads. It is not wrong to loose reads if you know why!
We also apply some quality and low complexity filtering together with the read-end trimming and the paired-read merging.
fastp --max_len1 200 --max_len2 180 --length_required 100 \
      --disable_adapter_trimming \
      --low_complexity_filter --complexity_threshold 30 \
      -i SP05_R1.fastq.gz -I SP05_R2.fastq.gz \
      -o SP05_R1_trim.fastq.gz -O SP05_R2_trim.fastq.gz
## Merge Trimmed Reads
flash SP05_R1_trim.fastq.gz SP05_R2_trim.fastq.gz
## Rename Output
cp out.extendedFrags.fastq SP05_R12.fq
So, now we are ready for the next step.
Primer Site Trimming
The primer site needs to be remove since we added it to the amplicon during the PCR. In other words, the primer site does not represent biological value. We are using cutadapt to trim primer sites.
## cutadapt
cutadapt="/usr/local/cutadapt/bin/cutadapt"
${cutadapt} --help

## Forward Primer
${cutadapt} -g CAGCNGCCGCGGTAANAC -e 0.1 -O 18 --trimmed-only -o SP05_R12_trimPF.fq SP05_R12.fq
grep "@M" -c SP05_R12_trimPF.fq

## Reverse Primer
${cutadapt} -a GATTAGANACCCNNGTAGTCC -e 0.1 -O 21 --trimmed-only -o SP05_R12_trimPF_trimPR.fq SP05_R12_trimPF.fq
grep "@M" -c SP05_R12_trimPF_trimPR.fq
OTU Clustering
We are using USEARCH for the clustering and mapping the reads back to the clusters. The clusters are called operational taxonomic units (OTU). An OTU is an operational definition used to classify groups of related sequences. These are not species and OTUs do not exist in nature. They are ad-hoc clusters made for convenience
## USEARCH (v11.0.667_i86linux32)
u="/usr/local/usearch"
${u}

## De-replicate Amplicons
${u} -fastx_uniques SP05_R12_trimPF_trimPR.fq -fastaout SP05_Amplicons_Uniques.fa -sizeout

# Have a closer look at the stats:
# 9318 seqs, 4655 uniques, 3341 singletons (71.8%)
# Min size 1, median 1, max 221, avg 2.00

## Create 97%-id OTU clusters and filter chimeras
${u} -cluster_otus SP05_Amplicons_Uniques.fa -otus SP05_Amplicons_OTU.fa -relabel OTU

# 660 OTUs, 54 chimeras
# Chimera removal is part of the clustering.

## Make OTU table (1 sample)
${u} -otutab SP05_R12.fq -otus SP05_Amplicons_OTU.fa -otutabout SP05_OTU.tab

## OTU-Table Summary
${u} -otutab_stats SP05_OTU.tab -output SP05_OTU.report
cat SP05_OTU.report
Taxonomic Assignments
Now we have a count table with OTUs as rows and sample(s) as columns. In a next step we try find taxonomic associations with known species.
## Reference
REF="/usr/local/references/rdp_16s.fa"

## Data Format Reference
head -n 4 ${REF}

## Size Reference
grep ">" -c ${REF}
# N = 10,049

## Taxonomic Prediction
${u} -sintax SP05_Amplicons_OTU.fa -db ${REF} -strand both \
  -tabbedout SP05_Amplicons_OTU_RDP.tax -sintax_cutoff 0.85

## Results
grep "OTU1" -w SP05_Amplicons_OTU_RDP.tax
# OTU1  d:Bacteria(1.0000),p:"Acidobacteria"(1.0000),c:Acidobacteria_Gp4(1.0000),g:Gp4(1.0000)
The most common OTU (OTU1) could represent an Acidobacteria but the annotation is not very deep. Let us see if we can get a better annotation using NCBI BLAST. By default, NCBI BLAST is using the entire nucleotide collection (nr/nt) producing rather unspecific hits. I recommend to use the reference RNA sequences database instead.
grep "OTU1" -w SP05_Amplicons_OTU.fa -A 4
>OTU1
GGGGGGAGCAAGCGTTGTTCGGATTTACTGGGCGTAAAGGGCGCGTAGGCGGTCAGCACAAGTCAGTTGTGAAATCTCCGGGCTTAACTCGGAAAGGTCAACTGATACTGTGCGACTAGAGTGCAGAAGGGGCAACTGGAATTCTCGGTGTAGCGGTGAAATGCGTAGATATCGAGAGGAACACCTGCGGCGAAGGCGGGTTGCTGGGCTGACACTGACGCTGAGGCGCGAAAGCCAGGGGAGCGAACGG
We got good but not perfect hits. The top 5 blast hits are equally good:
- NR_151987.1 Brevitalea aridisoli - Bacteria;Acidobacteria;Blastocatellia;Blastocatellales;Pyrinomonadaceae;Brevitalea.
- NR_151988.1 Brevitalea deliciosa - Bacteria;Acidobacteria;Blastocatellia;Blastocatellales;Pyrinomonadaceae;Brevitalea.
- NR_151986.1 Arenimicrobium luteum - Bacteria;Acidobacteria;Blastocatellia;Blastocatellales;Pyrinomonadaceae; Arenimicrobium.
- NR_146026.1 Tellurimicrobium multivorans - Bacteria;Acidobacteria;Blastocatellia Blastocatellales; Blastocatellaceae;Tellurimicrobium.
- NR_146021.1 Stenotrophobacter namibiensis - Bacteria;Acidobacteria;Blastocatellia;Blastocatellales;Blastocatellaceae;Stenotrophobacter.
The top 5 blast results would agree on the following annotation for OTU1:
OTU1 d:Bacteria,p:Acidobacteria,c:Blastocatellia,o:Blastocatellale
It seems we improved the taxonomic prediction if we can trust the NCBI references.
As an alternative to a Blast-Search we could use SILVA's SINA aligner. A classification service specific for SSU sequence fragments.
# OTU1 d:Bacteria;p:Acidobacteriota;c:Blastocatellia;o:Pyrinomonadales;f:Pyrinomonadaceae;RB41
The results agree mostly with the blast results with the exception for the order. It seems that the order label is inconsistent between references.
Taxonomic Assignments
The taxonomic assignments of the OTUs is a difficult and error-prone process. The reason are manifold. First, the perfect reference does not exist and the references avaible are incomplete and contain errors. The amplicon might be to short or not diverse enough to provide enough taxonomic resolution. Taxonomic association are always predictions and should never be trusted blindly.
Data Analysis
Challenges
For the exercises you need to download and unzip the R script, the data, and some "homebrew" functions. All files are combined in one zipped file. Below are all the steps in R you need to download, unzip, and open the R script. Have fun!
## You need this R library to use wget
library("HelpersMG")

## Working directory
getwd()

## Create a new working folder (if needed)
# dir.create("~/GDA")
# dir.create("~/GDA/AmpSeq")

## Change to new working directory
setwd("~/GDA/AmpSeq")

## Confirm new working directory
getwd()

## Download data (R data image file)
data.url <- "https://www.gdc-docs.ethz.ch/GeneticDiversityAnalysis/GDA20/data/AmpSeqExample.zip"
utils::download.file(data.url, destfile = "AmpSeqExample.zip")
unzip("AmpSeqExample.zip")

## Have a look at the folder content
list.files()
# These are the files you should see in your working directory:
# (1) AmpSeq.zip: your original data file
# (2) AmpSeqExercises.R: R script
# (3) Chaillou2015.Rdata: input file
# (4) graphical_methods.R: file with various functions

## Remove File and Directory
file.remove("AmpSeqExample.zip")

## Load R script
file.edit("AmpSeqExercises.R")
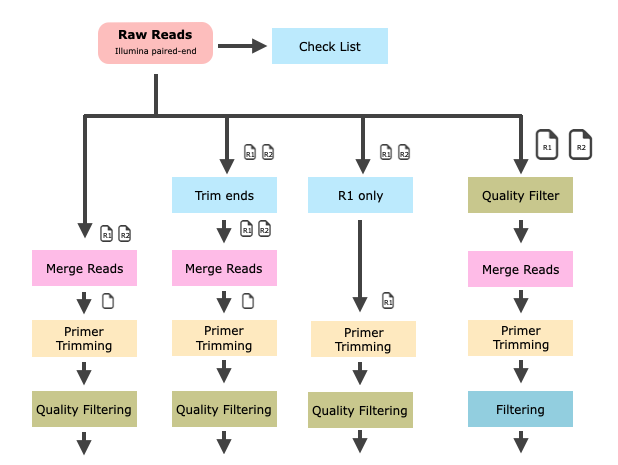
AmpSeq Data-Prep Workflows and more ...
Data Analysis
- Phyloseq - analysis of microbiological communities
- microbiome R package
- ampvis2
- vegan: an R package for community ecologists
- mixOmics